Orlando’s Better Data Can Make You Safer On Your Own Bike
Editor’s note
We love to give you the tools to keep you safe on your bike. New research from transportation planner and CyclingSavvy co-founder Mighk Wilson offers surprising insights about your safety when riding in bike lanes, on sidewalks, or on the edge of travel lanes.
In this three-part series, Mighk describes his bikeway research, and how the way he gathered data for it differs in critical ways from other bikeway studies.
You’ll be impressed.
Metro Orlando Bikeway Study
 This is the first in a series of articles on new bikeway research which I’ve completed for my employer, MetroPlan Orlando. Findings of this research are useful for planners and designers, and for bicyclists. The study compared risks to bicyclists riding on sidewalks, on streets with bike lanes, and on streets without.
This first segment will cover:
- My own professional and personal history with bike lanes;
- How most bikeway studies don’t clearly show how bikeways might prevent motorist-caused crashes; and
- An overview of the data and basic findings of my research.
The second segment will help you make better decisions as a bicyclist. The third segment will address the “safety in numbers” premise and how bicyclists truly get to “Vision Zero” (the goal of eliminating fatal and serious injury crashes) [1].
Part One: Better Data, Better Understanding
I Used to Be Mr. Bike Lane
When I started work as a bicycle planner for MetroPlan Orlando in 1993, I was quite supportive of bike lanes. After all, the cities and towns that had lots of bicycle traffic had them. Wouldn’t that mean that people there had good experiences with them?
But it didn’t take me long to cross paths via internet forums with the infamous John Forester [2], and to have my assumptions challenged.
While Forester and his supporters had reasonable concerns about bike lanes, there was no solid data to show that they were worse (or better) for bicyclists than a regular travel lane. Concern about bike lanes was based mostly on direct experience. I had little, as the Orlando area had no bike lanes.
I found it frustrating that some bicyclists complained so much about bike lanes, while others expressed a strong preference for them.

A Quest for Answers
It took quite a few years for the Orlando area to get bike lanes and for me to gain enough experience with them. I found myself frequently having types of conflicts that rarely occurred when I used regular travel lanes. But still, I could find no good objective evidence about relative safety.
It became clear that to assess it, I would need lots of detailed crash data and good measures of bicyclist counts and behaviors.
Assembling crash data was fairly easy. MetroPlan Orlando had been collecting and analyzing crash reports since 1997. Also, I had a solid understanding of how bicycle/motor vehicle crashes happen.
But getting good counts would entail thousands of hours sitting next to roads, counting and observing bicyclists.
A few years ago, computer/video technology finally made counting efficient and effective. I now have the combination of crash, behavior and exposure data to allow useful analysis. But before I get to that, I want briefly to discuss the shortcomings of other studies.
Sloppy Bikeway Research
A number of studies published over the past decade or so have purported to show better safety performance of streets with bikeways compared to those without. Some are before-and-after studies of the same streets. These studies have a major problem: they treat all bicyclist-versus-motorist crashes the same, as if all would be affected in some way by the presence of a bikeway.
But clearly, the presence of a bikeway would not impact many crashes one way or the other. For example, a bicyclist might roll out of a driveway and fail to yield to an approaching car, or a motorist might blow through a red traffic signal at speed. Also, some crash types would likely be made more common by the presence of a bikeway, such as “wrong-way bicyclist” crashes when a bikeway either encourages or requires bicyclists to travel facing traffic.
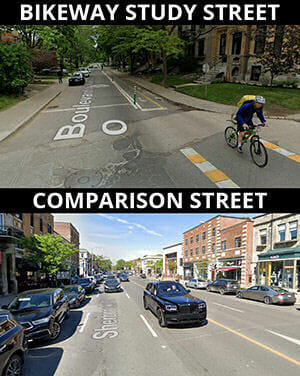
A bikeway study street and its “comparison street” in the 2011 Montreal cycle track study.
Such studies have too many other kinds of failures to describe here, but the highly-touted 2011 Montreal cycle track study by Lusk and Furth [3] had a particularly serious failing. That study compared parallel streets with and without cycle tracks, but the paired streets were often radically different from one another.
One comparison, for example, was of a one-lane, one-way, low-volume residential street with a cycle track vs. a two-way, four lane street with high traffic volume and storefronts. A traffic engineering journal’s peer reviewers likely would have thrown out the Montreal study, but an injury prevention journal published it. The reviewers apparently didn’t catch this major failure of methodology.
Our Data
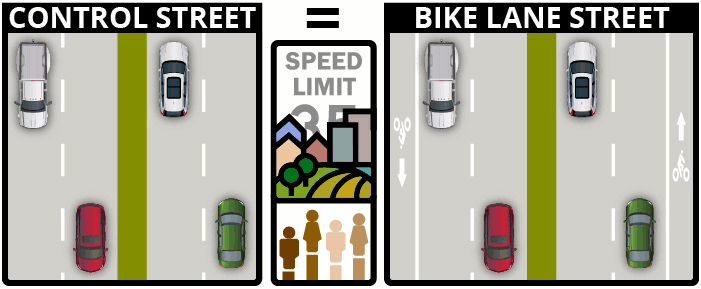
The MetroPlan study ensured that the control (no-bike-lane) streets were like the bike lane streets: same number of lanes, median type, same or similar posted speeds, similar traffic volumes, similar land use, and even similar surrounding populations.
We selected ten streets that had had bike lanes for at least ten years, and for each of them, a control street that also had not seen major changes for ten years. The streets were mostly suburban, with just a few a bit more urban.
We had ten years of crash data for all of the streets, categorized by crash type (who turned, who crossed, who violated right-of-way, etc.); the bicyclist’s position leading up to the crash (travel lane, bike lane, sidewalk or other non-roadway position); and the bicyclist’s direction of travel (with or facing the regular flow of vehicular traffic, or crossing the roadway).
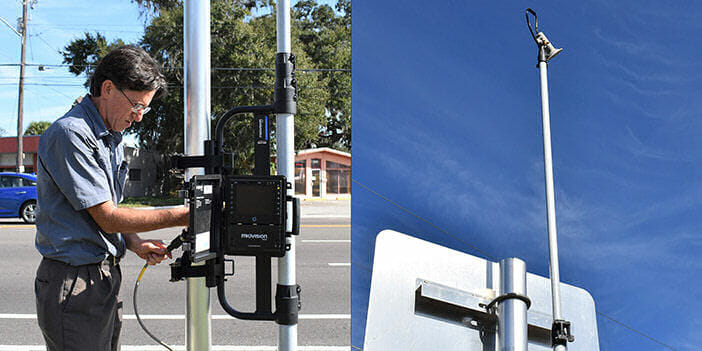
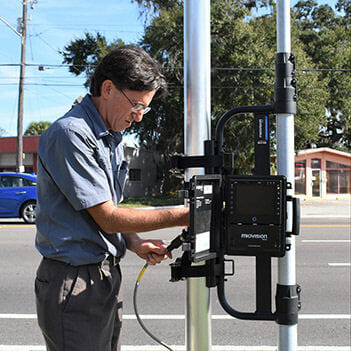
Left: Mighk Wilson with the MioVision camera system, which is portable and records 48 hours of video. Right: the pole-mounted camera provides a birds-eye view of the roadway and the sidewalk.
Video Data Collection
Using a MioVision camera, we counted bicyclists, with their position and direction, on each bike-lane street and its control street during the same 48-hour period. With this information, we were able to estimate miles of bicyclist travel by multiplying the counts by the length of the study street, and then by 1,825, which gets us from 48 hours to ten years of exposure.
With ten years of crashes and of estimated exposure, we could calculate Bicyclist Miles Between Crashes. A high number means lower risk. (I’ve rounded to the nearest thousand miles for clarity.)
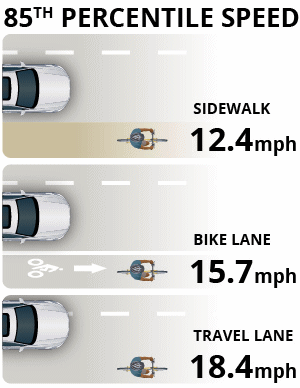 With the video, we were also able to estimate typical speeds for bicyclists. Traffic engineers typically use an “85th-percentile speed” for traffic studies. (85% of the travelers are going at or below this speed.) We found the 85th-percentile speed to be 12.4 MPH for sidewalk bicyclists, 15.7 MPH for bike-lane users, and 18.4 MPH for travel-lane users.
We also looked at five shared-use sidepaths (“trails” directly adjacent to roadways) that had been in place for more than ten years, and collected the same crash and exposure data for them.
Key Findings
This section will explore the risk of a motorist-caused crash.
Most Important Factor: Bicyclist Direction
It is legal to bike against traffic on a sidewalk or path, and illegal in a bike lane or travel lane, but regardless of bicyclist position, we found bicyclist direction to be the most important risk factor. The risk ratio was the same, 5.3 times greater, except for bike lanes, where it was 4.3 times. This means that bicyclists riding against the flow of motor vehicle traffic are 4.3 to 5.3 times more likely to be in a crash than those who ride with motor vehicle traffic flow.
These results show higher relative risk than prior studies, but this study had many more streets and better bicyclist-count data. (Wachtel and Lewiston in 1993 [4] found 3.6 times greater risk, and Huang and Petritsch in 2007 [5] found 4.4 times greater risk.)
Risk by Position
So we know that going with the flow is much, much safer. But if we’re going with the flow, is it better to be along the edge of a travel lane, in a bike lane, or on a sidewalk? For bicyclists traveling with the flow, the Miles Between Motorist-Caused Crashes were:
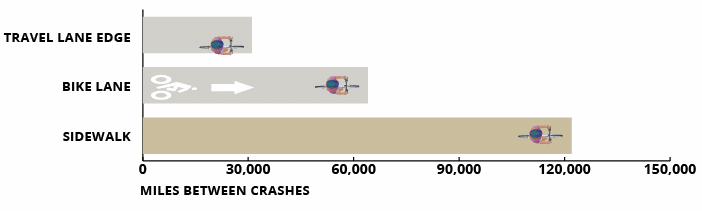
Travel Lane Edge – 31,000 Miles (Highest Risk)
Bike Lane – 64,000 Miles
Sidewalk – 122,000 Miles (Lowest Risk)
I have assumed that the bicyclist in the travel lane is riding along its right edge. Very few bicyclists use lane control, and only a tiny percentage of crashes involves bicyclists using it. This study could not assess that strategy.
These numbers make it look like the sidewalk is the safest place to ride, with four times lower risk than the edge of the travel lane. The sidewalk looks better than the bike lane too. But stay with me…
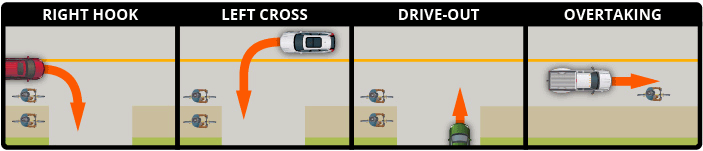
The four main motorist-caused crash types for bicyclists going with the flow were: overtaking motorist, drive-out, right hook, and left cross. (Dooring was not a significant issue with these streets; only two of the twenty streets had parallel on-street parking. There was only one reported dooring during the ten-year period.)
Overtaking crashes are very rare. Of 428 motorist-caused crashes on these twenty streets, only ten (2%) involved overtaking motorists. Six of those ten involved bicyclists in bike lanes. But the bike lanes did show a much lower risk for overtaking crashes: 585,000 miles between crashes compared to 92,000 miles for travel-lane bicyclists.
Setting Overtaking Crashes Aside
For now, let’s set overtaking crashes aside and look at the risks for drive-outs, right hooks and left crosses. Again, we consider only bicyclists going with the flow.
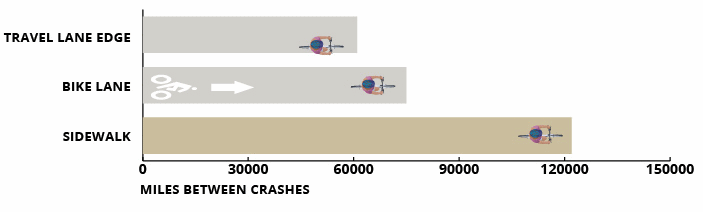
Travel Lane Edge – 61,000 Miles (Highest Risk)
Bike Lane – 75,000 Miles
Sidewalk – 122,000 Miles (Lowest Risk)
Here we still see much lower risks for sidewalks, and somewhat lower for bike lanes. But why would there be lower risks for those crash types? They all occur at intersections and driveways with no sort of “protection” for the bicyclist. Don’t experienced bicyclists avoid using sidewalks — and sometimes even bike lanes — precisely to avoid such conflicts?
I have the answer for you in the next article.
Footnotes
[1] Wikipedia article describing Vision Zero, with links to other resources.
[2] John Forester, pioneering bicycling educator, died in April 2020. We have an evenhanded article about him.
[3] The Montreal study may be found here. Michael Kary’s critique of it may be found here, Wayne Pein’s, here and Paul Schimek’s here.
[4] The Wachtel and Lewiston study is available online.
[5] The Huang and Petritsch study is available on the Metroplan Orlando site.


I’m excited about the results of your study.
One question, however. You assume that “the bicyclist in the travel lane is riding along its right edge. Very few bicyclists use lane control, and only a tiny percentage of crashes involve bicyclists using it.”
Where did you get the data to make those two assumptions (the number of cyclists who use lane control and the percentage of crashes involving those who do)?
I’m not saying your assumptions are unfounded; they are consistent with my own empirical observation (what I see with my own two eyes). I simply want to be able to answer the questions that I expect to hear when I go to my city’s planners with your report.
Thank you Aaron. Based on the crash reports, none of the cyclists in this study could be reliably classified as using lane control. Even in my entire crash database of nearly 7,000 crashes over 9 years, I could find less than ten. On the exposure side, like you I can only go by what I see while out on the road. Out of the 1,557 cyclists counted on the control streets by video, only 196 (13%) were in a travel lane. That number is already getting pretty small for effective analysis; using, say one-tenth of that would be statistically useless.
Looks like a very careful study. Thanks for your research Mighk! I wish FDOT could consider the high “against the flow” risk factor when installing bike lanes on only one-side of the roadway in Daytona Beach. Daytona Police have observed people on bicycles going against traffic (south bound) in the bike lane on Nova Rd (SR 5A) between about Orange Ave and Clyde Morris Blvd. The other south-bound side of the Nova has no bike lane or shoulder. It does have Bike May Use Full Lane signs. Nova Rd is six lanes wide and a 50 MPH speed limit in this section. Thanks for my Cycling Savvy training I use lane control all the time the get around the Daytona area, but not on these kinds of very high-speed arterials with no shoulders. I feel people are really temped ride the against the flow in this bike lane. I wish to know more about how these roadway resurfacing lane marking changes get vetted. A few miles north on the Nova road there are comfortable buffered bike lanes. It is so hit and miss and doesn’t connect into any kind of network. This all happens outside of the TPO bike/ped committee because such resurfacing is considered maintenance and the TPO doesn’t have funding for such projects.
Was that unpaired bike lane intended as bi-directional? Standards generally don’t allow for that, or for putting a uni-directional bike lane on only one side of a two-way roadway.
I’m sure the bike lane is intended to be uni-directional. I checked and there are ” WRONG WAY; RIDE -WITH- TRAFFIC” signs pointed against the flow. There is a shared-use path parallel to this bike lane separated by a canal, so there is an alternative, albeit with more limited access. On the opposite side of the road there is no shoulder, but there is a sidewalk. Perhaps FDOT thought bike lane on one side vs. sidewalk on the other is OK. I’m curious if this decision making is documented somewhere. That particular sidewalk is one of the few times I’ve used my helmet in Daytona Beach. Tree branches stick out into the sidewalk and are difficult to see at night. Daytona Beach is currently installing what a believe is the first bi-directional bike lane in town. It runs for a few short blocks and a fairly quiet street, Ballough Rd. It will have a painted striped buffer and vertical flexible posts. This is for a gap in the East Coast Greenway where a trail isn’t possible until a bridge is widened.
You’ve collected some very useful data on understanding crash risks for bicyclists. I look forward to reading the next two installments.
One thing I don’t understand is why you use the 85th percentile to report the speed of bicyclists in different contexts. This is used for reporting the results of motor vehicle speed surveys because traffic engineers want to know the speed below which all but the 15% of fastest motorists drive. And in some states, like here in California, a posted speed limit cannot be enforced using radar if it is below the 85th percentile of surveyed speed.
But I don’t see how any of that is relevant to bicyclists. I think a typical bicyclist speed would be better communicated by reporting the 50th percentile which is the median speed.
That’s something I gave a lot of thought to. For bicyclists in most cases we’re not concerned about them exceeding the posted speed, but I think it’s important for designers to have an idea of how fast users are going, and 85th percentile is generally thought of as representative of the “normal range” of users. I don’t recall, and didn’t record, the exact median speeds (though I could go back and find them), but I seem to recall they were close to the mean. The mean speeds were 14.5 for travel lane, 11.8 for bike lane, and 9.3 for sidewalk. The percent difference in speed between bike lane and sidewalk (27%) was the same for both mean and 85th percentile. For travel lane compared to bike lane it was 17% higher for 85th percentile and 23% higher for mean.
BTW, sidepath speeds (which gets a mention in the next part) were 11.7 for mean and 16.3 for 85th percentile.
Thank for the additional information.
The mean bicyclist speeds should be quite close to the median–perhaps just bit higher because the mean in influenced by the values of the highest speeds, unlike the median.
Thanks Mighk for sharing this fascinating and unique study!!!
It will probably take me re-reading it a few times to fully grasp the content.
I know this really wasn’t the goal of your study nor should it be, but within the raw footage did you or can you put percentages on types of bicycles used (road, MTB, hybrids, e-Bikes in general, etc.)? Their corresponding speeds and where ridden is probably obvious to us all and I’m sure any footage analyzed would confirm this.
I’d be very curious to know how e-Bike use played a role in the riders’ behaviors, their speeds, and type of riding behaviors (driver, edge, pedestrian). Is that analysis available or possible?
Thanks!
Thanks Clint. There’s much more to come! As for bike type, it’s rather limited. The video resolution is not very good. Good enough to discern a road bike from a mountain bike, but maybe not a mountain bike from a city bike, or to tell if it’s an e-bike. And the numbers by bike types would be small enough (especially e-bikes) to be statistically unreliable. I doubt there was more than one or two e-bikes in the data. I didn’t estimate the speed of every bike counted (that would have been very time consuming, and not always possible); just a sample for each position.
Thanks Mighk!
Of course no matter what type of bicycle one uses and the speeds achieved, it really comes down to their position on the road! I just feel this is especially critical for novice users of e-Bikes, which are faster, heavier, and less nimble.
Thanks for all your work Mighk; great information! Looking forward to the next installment and full report.
hi Mighk,
Is the Metro Orlando Bikeway Study itself posted somewhere?
Not yet. The full report is still undergoing internal review. But I’ve presented the key findings to our board and committees.
thx. Looking forward to it.