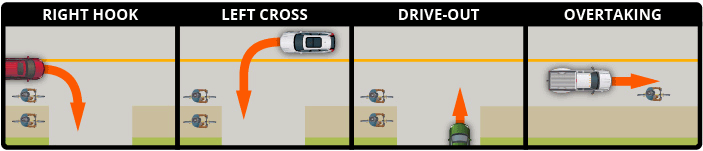
Bikeway Study: Strategies to Improve Bicyclist Safety
In Part One of this series, I discussed how most bikeway studies fail to address the key factors that lead to crashes, and I described the basic findings of Metroplan Orlando’s new bikeway study. Part Two went into deeper detail to show how cyclist direction, position and speed affect crash risk. In this final part, I’ll discuss how data from the study should inform attitudes and strategies to improve cyclist safety.
Jacobsen’s widely-cited study
In a 2003 paper in Injury Prevention [1], Peter Jacobsen found that higher bicycle use went with lower cyclist crash rates across geographies (European nations and California cities) and over time (United Kingdom and The Netherlands). As cycling (and walking) increased, it seemed that the overall crash risk dropped. In the discussion section of the paper, Jacobsen wrote:
“It seems unlikely that people walking or bicycling obey traffic laws more or defer to motorists more in societies or time periods with greater walking and bicycling. Indeed, it seems less likely, and hence unable to explain the observed results. Adaptation in motorist behavior seems more plausible and other discussions support that view.”
Though Jacobsen provided no behavioral data to support this explanation, it has become popular among bikeway proponents. When skeptics point out conflicts created by many bikeways, advocates have a handy response: “But there’s safety in numbers…” Others have questioned Jacobsen’s math [2].
Does Jacobsen’s conclusion hold water?
Our bikeway study shows whether that assumption holds water. Did rates for motorist-caused or bicyclist-caused crashes increase or decrease with larger numbers of bicyclists?
I divided the twenty streets into five groups of four each, ranked from lowest to highest bicyclist counts over 10 years. The table below shows enormous differences in the amount of bicyclist travel. There was 60 times as much bicycle use on the busiest streets as on the least busy.
| Quintile Streets by Bicyclist Exposure | Lowest Quintile | 2nd Quintile | 3rd Quintile | 4th Quintile | Top Quintile |
|---|---|---|---|---|---|
| Bicyclist Miles Traveled | 819,000 | 5.344 M | 9.674 M | 13.341 M | 49.218 M |
| Miles Between Motorist-Caused Crashes | 19,000 | 46,000 | 39,000 | 49,000 | 45,000 |
| Miles Between Bicyclist-Caused Crashes | 13,000 | 73,000 | 125,000 | 205,000 | 198,000 |
I left the lowest 1/5 out of the analysis, because the bicyclist exposure and the numbers of crashes are tiny. Even from the second group to the top group, there’s a nine-fold increase in bike use:
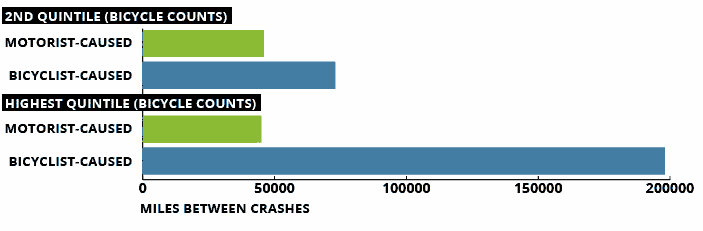
The results? There is little difference in the risk of motorist-caused crashes. (Remember, a higher number — more miles between crashes — means lower crash risk.) But bicyclist-caused crashes were 170% to 180% lower for the top and fourth quintiles!
Better overall bicyclist behavior is responsible for the “safety in numbers” effect. [3]
It’s plausible that motorist behavior improved some small amount on the higher usage streets, but that would probably be masked by the reduced risk due to slower cyclists on the sidewalks.
Three of the four streets in the 4th quintile (with the lowest risk for cyclist-caused crashes) are two-lane streets with bike lanes. These are just the type of streets touted as “bike-friendly.” Bikeway advocates like to say that bikeways attract potential cyclists who are “interested but concerned.” [4] Wouldn’t “interested but concerned” cyclists generally be more cautious and less likely to cause crashes?
The streets in the top quintile are all high-speed, high-volume, four- and six-lane arterials. Their obvious risks should encourage cyclists to use extra care.
It’s possible that motorist behavior does improve with still higher bicycle use. On the busiest cycling streets in the Orlando bikeway study, a bicyclist would pass any given point about once every eight minutes. In some European cities, bicyclists are almost always in sight. Motorists’ expectations would be radically different there.
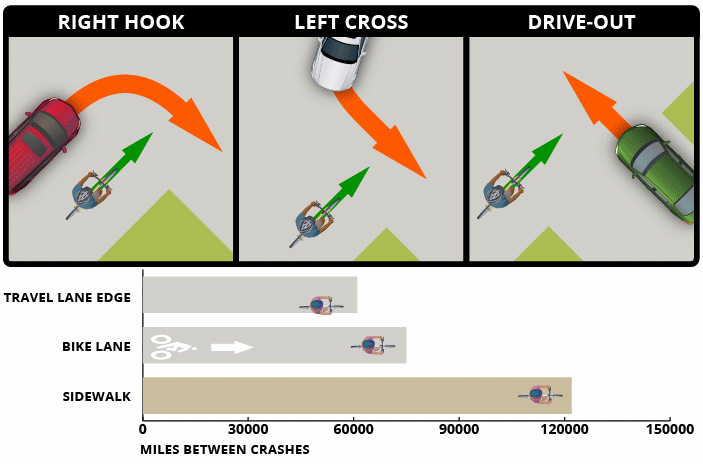
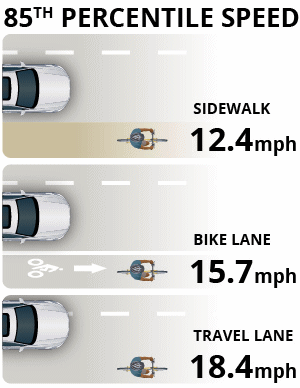
Study results: crash risks and numbers
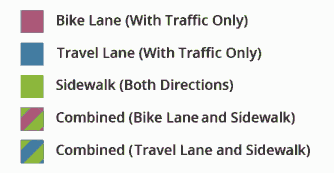
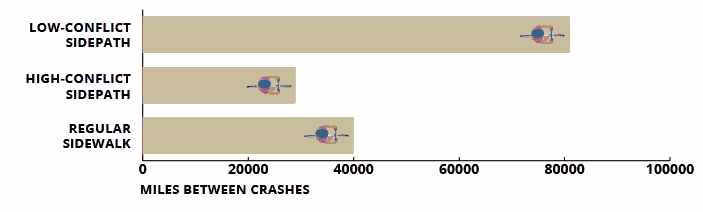
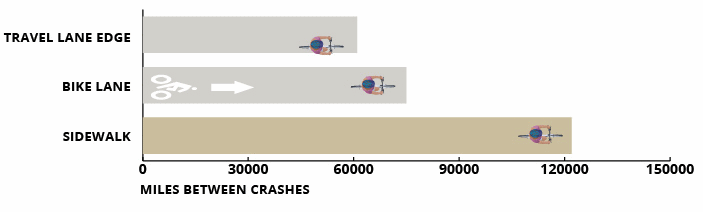
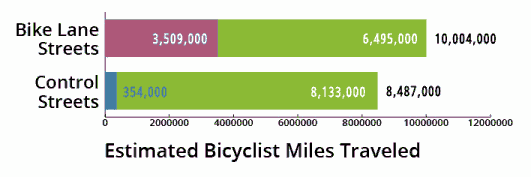
Key to the three graphs below
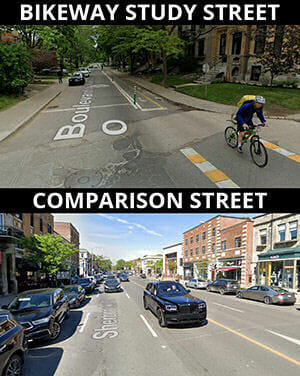
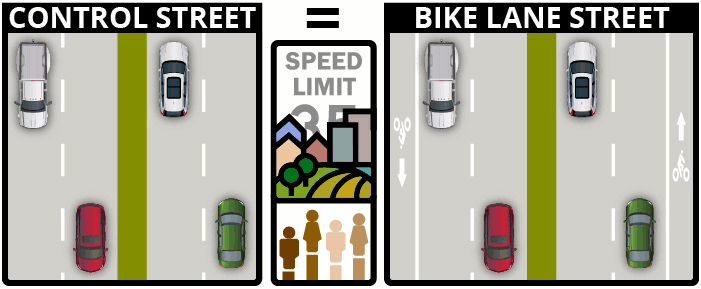
In this bikeway study, ten times as many cyclists were using bike lanes on the bike lane streets as were using the travel lanes on the comparison streets. Almost all bicyclists on the comparison streets were riding on sidewalks. But there was only 28 percent more bicyclist travel overall on the bike-lane streets. Most of the increase in bike lane use was due to bicyclists switching from the sidewalk to the bike lane.
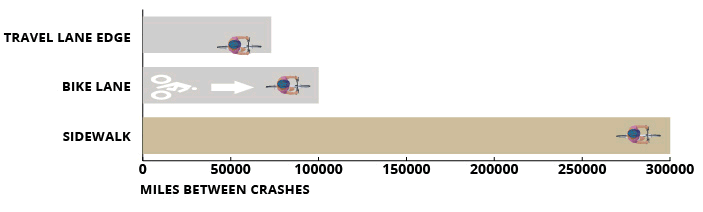
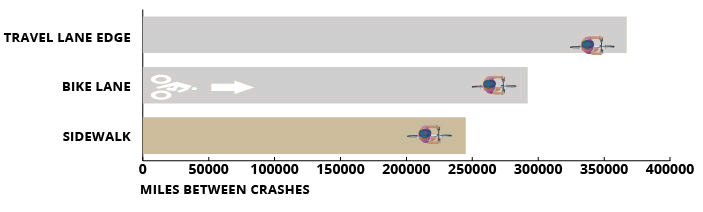
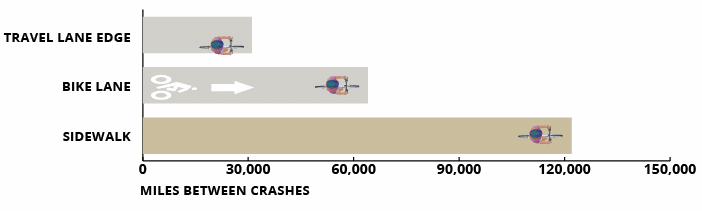
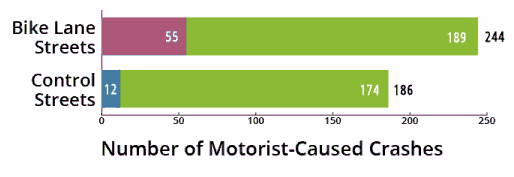
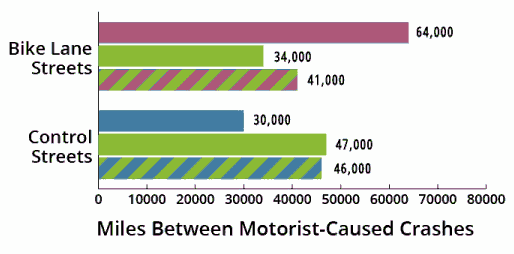
Though the bike lanes in this bikeway study presented a 53 percent lower crash risk per cyclist, four times as many motorist-caused crashes occurred in bike lanes on bike-lane streets as in travel lanes on the comparison streets. Almost all of the motorist-caused crashes on the comparison streets, and more than 3/4 of them on bike-lane streets, occurred on sidewalks and crosswalks.
The crash rate was higher for sidewalks on the bike-lane streets than on the comparison streets, and so the bike-lane streets had a higher overall crash rate, despite the 53 percent lower crash risk than with the travel lanes on comparison streets. (Recall that a longer bar in the graph below represents a longer mileage between crashes — lower crash risk.)
How to approach a Vision Zero goal
The stated goal of the Vision Zero Network is to eliminate all traffic fatalities and severe injuries, while increasing safe, healthy, equitable mobility for all. [5]
In order to truly approach this goal, much more effective risk-reduction methods than bike lanes and sidepaths must be implemented. As I highlighted in Part 2:
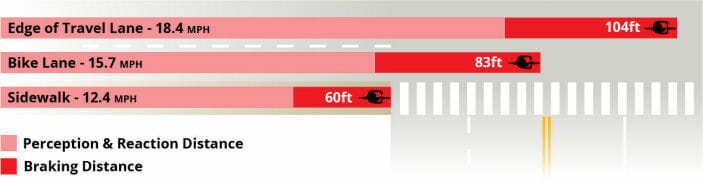
Rather than bikes lanes or sidewalks improving the safety of bicyclists, bicyclists are improving the safety of bike lanes or sidewalks by riding slower.
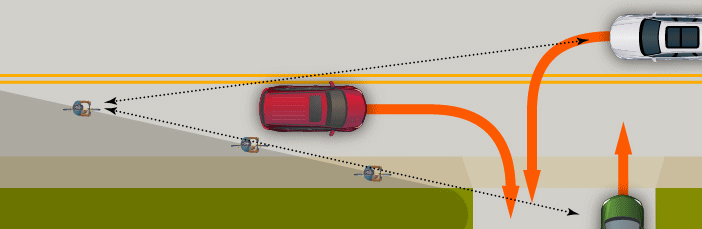
Bikeway advocates point to separated bike lanes, special bicycle signals, and channelized (“protected”) intersections as improvements over sidewalks and ordinary striped (“basic”) bike lanes. Slowing bicyclists at the approaches of intersections is part of bikeway designers’ design strategy, and may reduce risk somewhat.
In our Metro Orlando data, though, only 28 percent of motorist-caused turning and crossing crashes (for cyclists riding with the flow) occurred at signalized intersections. Forty-two percent occurred at unsignalized intersections (mostly minor cross streets), and 30 percent at driveways.
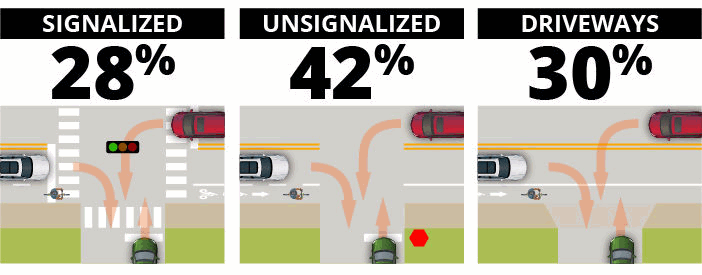
Most turning-movement collisions do not occur at signalized intersections. It is not practical to install preventive measures everywhere a motorist may cross the path of a bicyclist.
Mitigating all conflicts would require channelization to slow bicyclists at every intersection and driveway. This would be very costly — if even possible — and would slow cyclists nearly to pedestrian speeds, making bicycling less useful. [6]
Cyclists who tried to maintain their preferred speed could be blamed for crashes in the bikeways, or harassed for using lane control in the travel lanes. Now with electric-assist bikes, novice cyclists can ride on bikeways at the speeds of fitter, experienced cyclists. This is not a good combination.
Final Thoughts
The real world is a very messy place. As with many of life’s other challenges and questions, prevention of bicyclist crashes doesn’t lend itself to simple, straightforward answers. Nor does the question of whether bikeways really improve cyclist safety.
Cyclist skill, direction, position, speed, predictability, and conspicuity are concerns in crash prevention. So are motorist attention, speed and turning movements, lighting conditions, sight lines, traffic controls, and many other lesser concerns.
Attempting to address all of these factors with street and bikeway design is bound to fail. Design can improve safety, but it won’t get us as far as we’d like.
“Prepare the child for the path, not the path for the child.”
This saying (perhaps Native American) has been replaced with a popular version, found on parenting websites, using the word “road” instead of “path.” [7] and [8]
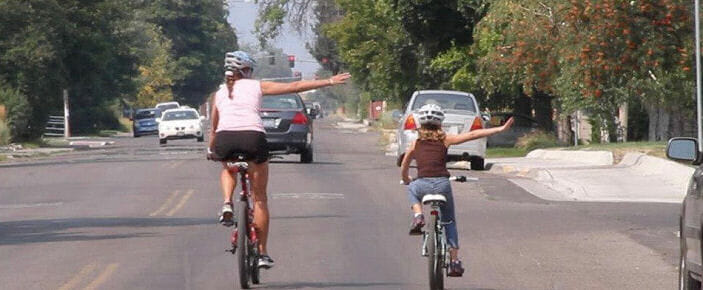
Prepare the child for the road, not the road for the child. Adults as well as children benefit from such a philosophy. Bicyclist training and education are not optional.
Footnotes
[2] The widely cited hyperbolic, descending curve which appears in every graph in Jacobsen’s report is an artifact of faulty math. Correct math gives varied results. See this for an explanation.
[3] Other research has also shown that bicyclist crash rates are lower on busy streets, notably a study by William Moritz from the 1990s. One factor: cyclists with more experience and greater skill are more likely to ride on busy streets. Also, more mentoring occurs where bicycling is more common. See discussion here.
[4] This categorization, one of four by Portland, Oregon bicycle coordinator Roger Geller, conflates two characteristics. Not all interested people are concerned, and vice versa.
[5] Wikipedia article describing Vision Zero, with links to other resources.
[6] The reduction in possible trip destinations within a given time is greater: in an urban grid: half the speed, 1/4 the destinations.
[8] However, Strong Towns offers the opposite advice.