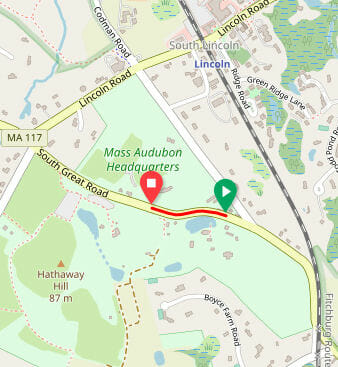
Several weeks ago I posted an article with dashcam video about roads with double yellow lines. I was driving the car, and slowed to follow a bicyclist at a blind curve on a two-lane rural highway. A large dump truck with a trailer appeared, coming from the opposite direction.
If I had held my speed and passed the bicyclist, I could not have merged left far enough to pass the bicyclist safely. Neither could the truck driver see me in time to make more room.
The location, in Lincoln, Massachusetts, USA
The bicyclist kept to the right as far as he could. He relied only on hope — and my good judgment — to avoid a close pass, or worse.
The video held a message for motorists: “What you don’t see can hurt you” — or hurt someone else (in this case, most likely the bicyclist).
Blind curves hold a message for bicyclists
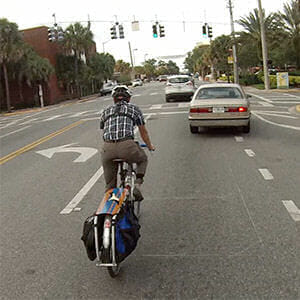
To clarify this message, I later rode the same stretch on a bicycle with front and rear video cameras.
As this video shows, I mostly rode on the shoulder. Several cars and a pickup truck passed me — no problem. No oncoming traffic prevented safe passing clearance.
But as I approached the blind curve, the shoulder narrowed to almost nothing. A big truck or other large vehicle could be approaching ahead. Who knew? Who could know? Neither I nor the driver of the car approaching from behind me could see around that curve.
Here’s what I did — what I always do — to protect myself:
I checked in my rearview mirror and took a look over my shoulder. If vehicles had been closer behind, I would have have used a hand signal to negotiate my way into line.
This car was far enough back that I simply merged to lane-control position. Then I made a hand signal: “Slow.”
The driver slowed to follow me for a few seconds. Once I had rounded the curve and could see far enough ahead, I released to the right and give a friendly wave. The driver accelerated and passed me.
How control and release promotes safe passing
What did my actions achieve?
They indicated that I was aware of the driver’s vehicle behind me.
They indicated that I knew it was unsafe to pass. Maybe I knew something the driver didn’t know!
In case the driver was impatient, they made it clear that passing would have to wait until we could both see far enough ahead.
The car’s slowing confirmed to me that the driver was aware of me and acting safely.
And by releasing as soon as it was safe, I demonstrated courtesy. No motorist wants to be “stuck” behind a cyclist.
As it turned out, there was no large truck, or not even a small car, approaching from the front.
But that isn’t the point. One could have been.
Might the driver behind me have passed, unable to see far enough ahead, if I had hugged the right edge of the road? I don’t know, and it doesn’t matter, because I took active control of my safety in a potentially dangerous situation.
When my safety is at stake, I choose not to rely on others to do the right thing. As we say in CyclingSavvy courses, drivers get smarter when we lead the dance.
https://cyclingsavvy.org/wp-content/uploads/2020/11/shadow.jpg392703John Allenhttps://cyclingsavvy.org/wp-content/uploads/2021/06/CS-logo_xlong-header.pngJohn Allen2020-11-27 11:55:092020-11-27 10:01:47“Control and Release” for safe passing
In Part One of this series, I discussed how most bikeway studies fail to address the key factors that lead to crashes, and I described the basic findings of Metroplan Orlando’s new bikeway study. Part Two went into deeper detail to show how cyclist direction, position and speed affect crash risk. In this final part, I’ll discuss how data from the study should inform attitudes and strategies to improve cyclist safety.
Jacobsen’s widely-cited study
In a 2003 paper in Injury Prevention [1], Peter Jacobsen found that higher bicycle use went with lower cyclist crash rates across geographies (European nations and California cities) and over time (United Kingdom and The Netherlands). As cycling (and walking) increased, it seemed that the overall crash risk dropped. In the discussion section of the paper, Jacobsen wrote:
“It seems unlikely that people walking or bicycling obey traffic laws more or defer to motorists more in societies or time periods with greater walking and bicycling.Indeed, it seems less likely, and hence unable to explain the observed results. Adaptation in motorist behavior seems more plausible and other discussions support that view.”
Though Jacobsen provided no behavioral data to support this explanation, it has become popular among bikeway proponents. When skeptics point out conflicts created by many bikeways, advocates have a handy response: “But there’s safety in numbers…” Others have questioned Jacobsen’s math [2].
Does Jacobsen’s conclusion hold water?
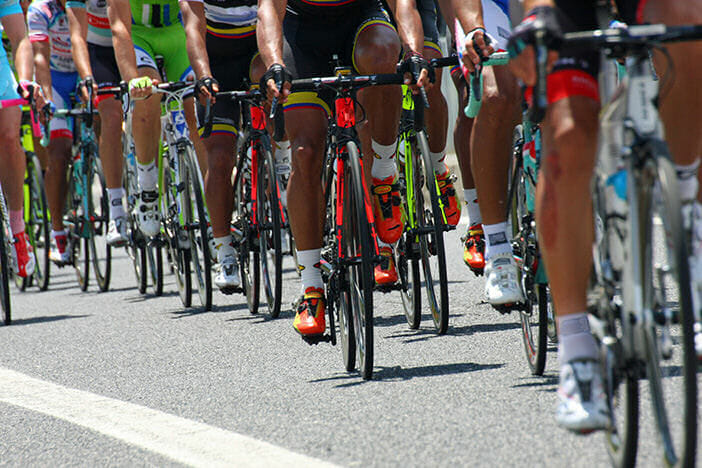
Our bikeway study shows whether that assumption holds water. Did rates for motorist-caused or bicyclist-caused crashes increase or decrease with larger numbers of bicyclists?
I divided the twenty streets into five groups of four each, ranked from lowest to highest bicyclist counts over 10 years. The table below shows enormous differences in the amount of bicyclist travel. There was 60 times as much bicycle use on the busiest streets as on the least busy.
Quintile Streets by Bicyclist Exposure
Lowest Quintile
2nd Quintile
3rd Quintile
4th Quintile
Top Quintile
Bicyclist Miles Traveled
819,000
5.344 M
9.674 M
13.341 M
49.218 M
Miles Between Motorist-Caused Crashes
19,000
46,000
39,000
49,000
45,000
Miles Between Bicyclist-Caused Crashes
13,000
73,000
125,000
205,000
198,000
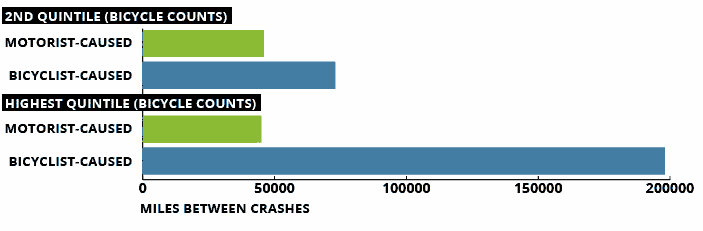
I left the lowest 1/5 out of the analysis, because the bicyclist exposure and the numbers of crashes are tiny. Even from the second group to the top group, there’s a nine-fold increase in bike use:
The results? There is little difference in the risk of motorist-caused crashes. (Remember, a higher number — more miles between crashes — means lower crash risk.) But bicyclist-caused crashes were 170% to 180% lower for the top and fourth quintiles!
Better overall bicyclist behavior is responsible for the “safety in numbers” effect. [3]
It’s plausible that motorist behavior improved some small amount on the higher usage streets, but that would probably be masked by the reduced risk due to slower cyclists on the sidewalks.
Three of the four streets in the 4th quintile (with the lowest risk for cyclist-caused crashes) are two-lane streets with bike lanes. These are just the type of streets touted as “bike-friendly.” Bikeway advocates like to say that bikeways attract potential cyclists who are “interested but concerned.” [4] Wouldn’t “interested but concerned” cyclists generally be more cautious and less likely to cause crashes?
The streets in the top quintile are all high-speed, high-volume, four- and six-lane arterials. Their obvious risks should encourage cyclists to use extra care.
It’s possible that motorist behavior does improve with still higher bicycle use. On the busiest cycling streets in the Orlando bikeway study, a bicyclist would pass any given point about once every eight minutes. In some European cities, bicyclists are almost always in sight. Motorists’ expectations would be radically different there.
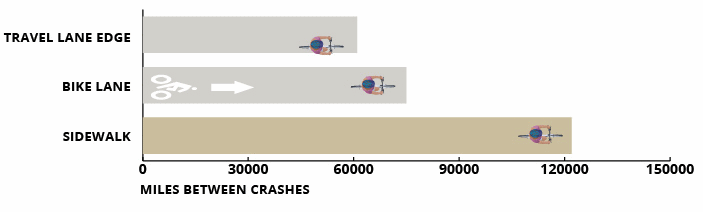
Study results: crash risks and numbers
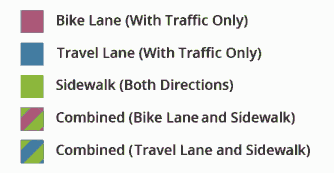
Key to the three graphs below
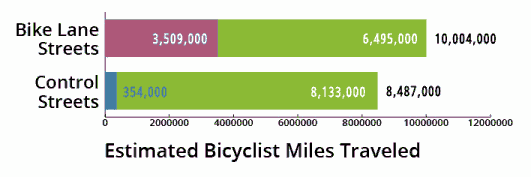
In this bikeway study, ten times as many cyclists were using bike lanes on the bike lane streets as were using the travel lanes on the comparison streets. Almost all bicyclists on the comparison streets were riding on sidewalks. But there was only 28 percent more bicyclist travel overall on the bike-lane streets. Most of the increase in bike lane use was due to bicyclists switching from the sidewalk to the bike lane.
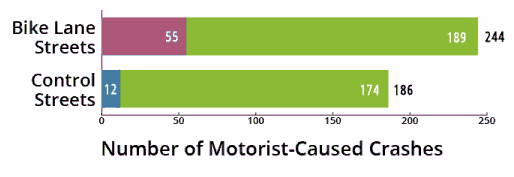
Though the bike lanes in this bikeway study presented a 53 percent lower crash risk per cyclist, four times as many motorist-caused crashes occurred in bike lanes on bike-lane streets as in travel lanes on the comparison streets. Almost all of the motorist-caused crashes on the comparison streets, and more than 3/4 of them on bike-lane streets, occurred on sidewalks and crosswalks.
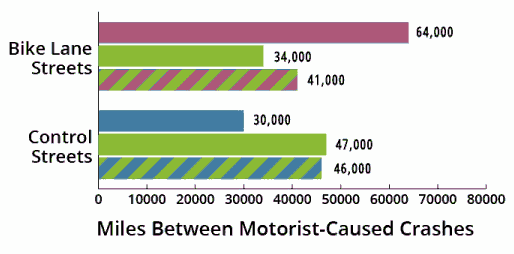
The crash rate was higher for sidewalks on the bike-lane streets than on the comparison streets, and so the bike-lane streets had a higher overall crash rate, despite the 53 percent lower crash risk than with the travel lanes on comparison streets. (Recall that a longer bar in the graph below represents a longer mileage between crashes — lower crash risk.)
How to approach a Vision Zero goal
The stated goal of the Vision Zero Network is to eliminate all traffic fatalities and severe injuries, while increasing safe, healthy, equitable mobility for all.[5]
In order to truly approach this goal, much more effective risk-reduction methods than bike lanes and sidepaths must be implemented. As I highlighted in Part 2:
Rather than bikes lanes or sidewalks improving the safety of bicyclists, bicyclists are improving the safety of bike lanes or sidewalks by riding slower.
Bikeway advocates point to separated bike lanes, special bicycle signals, and channelized (“protected”) intersections as improvements over sidewalks and ordinary striped (“basic”) bike lanes. Slowing bicyclists at the approaches of intersections is part of bikeway designers’ design strategy, and may reduce risk somewhat.
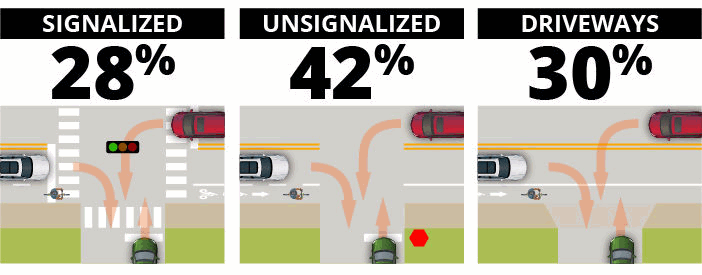
In our Metro Orlando data, though, only 28 percent of motorist-caused turning and crossing crashes (for cyclists riding with the flow) occurred at signalized intersections. Forty-two percent occurred at unsignalized intersections (mostly minor cross streets), and 30 percent at driveways.
Most turning-movement collisions do not occur at signalized intersections. It is not practical to install preventive measures everywhere a motorist may cross the path of a bicyclist.
Mitigating all conflicts would require channelization to slow bicyclists at every intersection and driveway. This would be very costly — if even possible — and would slow cyclists nearly to pedestrian speeds, making bicycling less useful. [6]
Cyclists who tried to maintain their preferred speed could be blamed for crashes in the bikeways, or harassed for using lane control in the travel lanes. Now with electric-assist bikes, novice cyclists can ride on bikeways at the speeds of fitter, experienced cyclists. This is not a good combination.
Final Thoughts
The real world is a very messy place. As with many of life’s other challenges and questions, prevention of bicyclist crashes doesn’t lend itself to simple, straightforward answers. Nor does the question of whether bikeways really improve cyclist safety.
Cyclist skill, direction, position, speed, predictability, and conspicuity are concerns in crash prevention. So are motorist attention, speed and turning movements, lighting conditions, sight lines, traffic controls, and many other lesser concerns.
Attempting to address all of these factors with street and bikeway design is bound to fail. Design can improve safety, but it won’t get us as far as we’d like.
“Prepare the child for the path, not the path for the child.”
This saying (perhaps Native American) has been replaced with a popular version, found on parenting websites, using the word “road” instead of “path.” [7] and [8]
Prepare the child for the road, not the road for the child. Adults as well as children benefit from such a philosophy. Bicyclist training and education are not optional.
[2] The widely cited hyperbolic, descending curve which appears in every graph in Jacobsen’s report is an artifact of faulty math. Correct math gives varied results. See this for an explanation.
[3] Other research has also shown that bicyclist crash rates are lower on busy streets, notably a study by William Moritz from the 1990s. One factor: cyclists with more experience and greater skill are more likely to ride on busy streets. Also, more mentoring occurs where bicycling is more common. See discussion here.
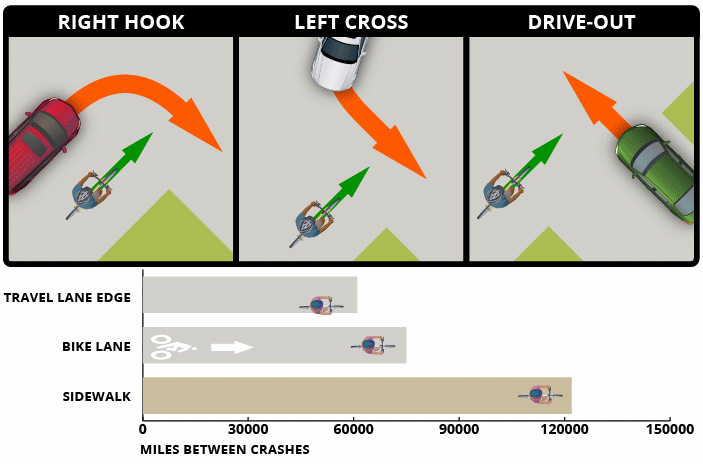
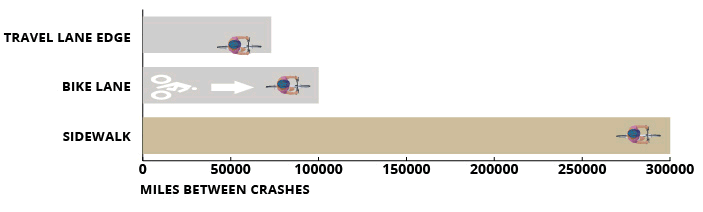
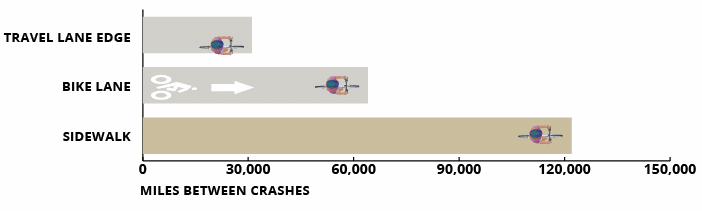
Last week, in the first of a three-part series describing my research on bikeway crash risk, I gave relative estimated risks for three types of motorist-caused crashes when bicyclists rode with the flow…
Travel Lane Edge – 61,000 Miles Between Crashes (Highest Risk)
Bike Lane – 75,000 Miles
Sidewalk – 122,000 Miles (Lowest Risk)
… and asked:
Why would the risk be lowest for bicyclists riding on sidewalks?
All crashes occurred at intersections and driveways with no sort of “protection” for the bicyclist. Don’t experienced bicyclists avoid using sidewalks — and sometimes even bike lanes — because riding in the street is supposed to help them avoid such conflicts?
Stay with me while I show you where the data led me as I pondered this question.
There are two key possibilities why these risks are lower: (1) Motorists might be more likely to yield to bike lane and sidewalk cyclists for some reason, and (2) Bike lane and sidewalk cyclists might be better able to avoid a motorist-caused crash.
It’s often argued and assumed that striping a bicycle lane leads motorists to look for and yield to cyclists. But the sidewalk cyclists had lower risk for these motorist-caused crashes than even the bike lane users, though sidewalks are neither designated nor designed for use by cyclists.
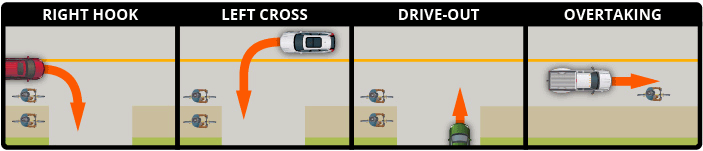
When we split up the crashes further, we see that only the risk of drive-outs is higher for bike-lane and sidewalk cyclists. Right-hook and left-cross crashes are less likely:
Right Hook & Left Cross
Travel Lane Edge – 73,000 Miles (Highest Risk)
Bike Lane – 100,000 Miles
Sidewalk – 300,000 Miles (Lowest Risk)
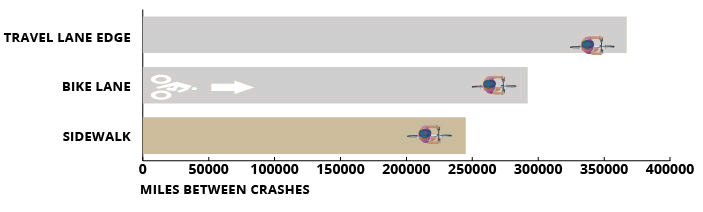
Sidewalk cyclists have the highest risk of drive-out crashes:
Drive-Out
Travel Lane Edge – 367,000 Miles (Lowest Risk)
Bike Lane – 292,000 Miles
Sidewalk – 245,000 Miles (Highest Risk)
Would motorists be more likely to yield to bike lane and sidewalk cyclists during overtaking right turns and opposing left turns, but not during drive-outs? I think that this is not more likely.
People Make Mistakes
News Flash: Humans make mistakes, whether they’re walking, bicycling, or driving motor vehicles.
We expect slower automobile and motorcycle drivers to be better able to react more quickly than faster ones to avoid conflicts caused by other motorists.
Why would we assume differently for bicyclists? [1]
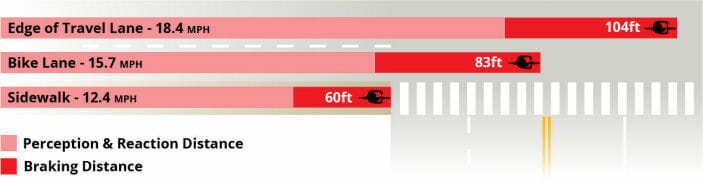
Recall the average speeds we found for cyclists using the three positions. A slower cyclist needs less perception and reaction time and less braking distance:
Bicyclist Position
Bicyclist Average (Mean) Speed
Bicyclist 85th Percentile Speed
Stopping Distance at 85th Percentile Speed
Travel Lane
14.5 MPH
18.4 MPH
104 Feet
Bike Lane
11.8 MPH
15.7 MPH
83 Feet
Sidewalk
9.3 MPH
12.4 MPH
60 Feet
Facing an impending motorist-caused crash, the bike-lane user riding at the 85th-percentile speed would need an additional 23 feet of stopping distance compared to the sidewalk rider — about the width of the typical two-lane street. The difference is about the same between the travel lane and the bike lane. The total difference between travel lane and sidewalk is about the width of four traffic lanes, or 44 feet.
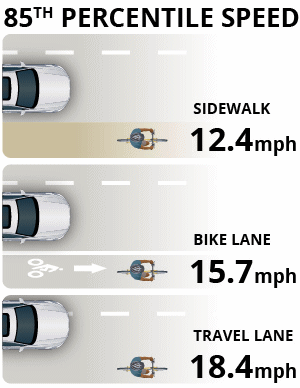
85th Percentile Bicyclist Speed and Stopping Distance
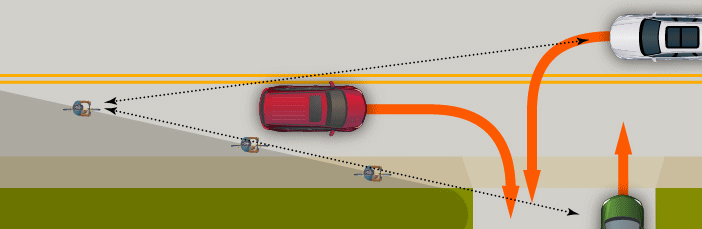
With right-hook and left-cross crashes, the motorist is coming from the bicyclist’s left, so the farther right the bicyclist is, the longer it takes for the motorist to reach the bicyclist’s path. This means that the bike lane or sidewalk bicyclist gets more reaction time. With drive-out crashes, the travel lane cyclist gets the most reaction time.
Rather than bikes lanes or sidewalks improving the safety of bicyclists, bicyclists are improving the safety of bike lanes or sidewalks by riding slower.
The Takeaway
If you’re going to ride on the sidewalk, bike lane or edge of the travel lane, you must ride slower.
I can’t tell you how slow is slow enough. But if you’re having more close calls with turning and crossing vehicles than you’d like, you need to either slow down, or use lane control. [2]
Based on the data, each additional mile per hour of bicyclist’s speed increases the risk of a motorist-caused crash about 9 percent.
With lane control, you give yourself much more reaction time for drive-out crashes, you eliminate the right hook crash, and you get more options for avoiding the left cross.
To put it in the simplest of terms: The faster you go, the more important it is for you to control your travel lane.
Sidepaths and Motorist-Caused Crash Risks
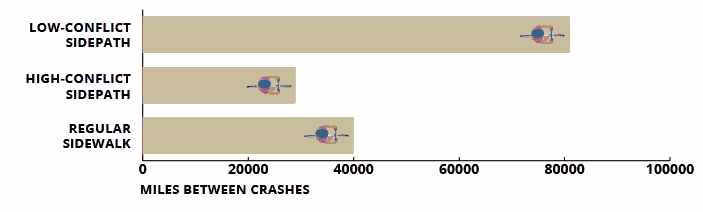
We performed the same type of analysis for five sidepaths which have been in place for over ten years. I was curious as to whether they would have better safety performance than a regular sidewalk. They did — about 68 percent better, on average — but it varied widely. Looking closer, I found that three of the paths had few intersections and commercial driveways — 4.6 per mile — while the other two had 11.6 per mile. Low-conflict paths had 64 percent lower motorist-caused crash rates compared to the other two paths; 51 percent lower than for ordinary sidewalks.
Low-Conflict Sidepaths
High-Conflict Sidepaths
Regular Sidewalks
Intersections and Commercial Driveways per Mile
4.6
11.6
10.5
Cyclist Miles Between Motorist-Caused Crashes
81,000 (Lowest Risk)
29,000 (Highest Risk)
40,000
Notice that high-conflict paths had 10 percent more intersections and driveways per mile than the sidewalks, but 38 percent higher motorist-caused crash risk, likely due to the higher bicyclist speeds on the paths (16.3 MPH versus 12.4 MPH for the sidewalks).
If we replace a sidewalk with a sidepath without somehow reducing the turning and crossing conflicts, the risk for the bicyclists will likely increase. This information helps you as a cyclist to decide when a sidepath might be reasonable to use — such as going with the flow on a low-conflict path — and when to avoid one — for example, when going against the flow, or going with the flow fast on a high-conflict path.
Bikeway designers can’t foresee every situation for you, so don’t expect them to.
[1] The 1976 Bikecentennial study found that 38% of crashes occurred on downgrades, though the constituted only 15% of the route. This was for all types of crashes.
https://cyclingsavvy.org/wp-content/uploads/2020/07/85th-percentile-speeds-feature-1.png353349Mighk Wilsonhttps://cyclingsavvy.org/wp-content/uploads/2021/06/CS-logo_xlong-header.pngMighk Wilson2020-07-24 11:55:302021-07-29 14:29:14Bikeway Study Part Two: Your Speed, Your Choice
We love to give you the tools to keep you safe on your bike. New research from transportation planner and CyclingSavvy co-founder Mighk Wilson offers surprising insights about your safety when riding in bike lanes, on sidewalks, or on the edge of travel lanes.
In this three-part series, Mighk describes his bikeway research, and how the way he gathered data for it differs in critical ways from other bikeway studies.
You’ll be impressed.
Metro Orlando Bikeway Study
This is the first in a series of articles on new bikeway research which I’ve completed for my employer, MetroPlan Orlando. Findings of this research are useful for planners and designers, and for bicyclists. The study compared risks to bicyclists riding on sidewalks, on streets with bike lanes, and on streets without.
This first segment will cover:
My own professional and personal history with bike lanes;
How most bikeway studies don’t clearly show how bikeways might prevent motorist-caused crashes; and
An overview of the data and basic findings of my research.
The second segment will help you make better decisions as a bicyclist. The third segment will address the “safety in numbers” premise and how bicyclists truly get to “Vision Zero” (the goal of eliminating fatal and serious injury crashes) [1].
Part One: Better Data, Better Understanding
I Used to Be Mr. Bike Lane
When I started work as a bicycle planner for MetroPlan Orlando in 1993, I was quite supportive of bike lanes. After all, the cities and towns that had lots of bicycle traffic had them. Wouldn’t that mean that people there had good experiences with them?
But it didn’t take me long to cross paths via internet forums with the infamous John Forester [2], and to have my assumptions challenged.
While Forester and his supporters had reasonable concerns about bike lanes, there was no solid data to show that they were worse (or better) for bicyclists than a regular travel lane. Concern about bike lanes was based mostly on direct experience. I had little, as the Orlando area had no bike lanes.
I found it frustrating that some bicyclists complained so much about bike lanes, while others expressed a strong preference for them.
A Quest for Answers
It took quite a few years for the Orlando area to get bike lanes and for me to gain enough experience with them. I found myself frequently having types of conflicts that rarely occurred when I used regular travel lanes. But still, I could find no good objective evidence about relative safety.
It became clear that to assess it, I would need lots of detailed crash data and good measures of bicyclist counts and behaviors.
Assembling crash data was fairly easy. MetroPlan Orlando had been collecting and analyzing crash reports since 1997. Also, I had a solid understanding of how bicycle/motor vehicle crashes happen.
But getting good counts would entail thousands of hours sitting next to roads, counting and observing bicyclists.
A few years ago, computer/video technology finally made counting efficient and effective. I now have the combination of crash, behavior and exposure data to allow useful analysis. But before I get to that, I want briefly to discuss the shortcomings of other studies.
Sloppy Bikeway Research
A number of studies published over the past decade or so have purported to show better safety performance of streets with bikeways compared to those without. Some are before-and-after studies of the same streets. These studies have a major problem: they treat all bicyclist-versus-motorist crashes the same, as if all would be affected in some way by the presence of a bikeway.
But clearly, the presence of a bikeway would not impact many crashes one way or the other. For example, a bicyclist might roll out of a driveway and fail to yield to an approaching car, or a motorist might blow through a red traffic signal at speed. Also, some crash types would likely be made more common by the presence of a bikeway, such as “wrong-way bicyclist” crashes when a bikeway either encourages or requires bicyclists to travel facing traffic.
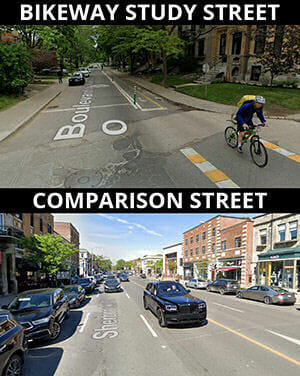
A bikeway study street and its “comparison street” in the 2011 Montreal cycle track study.
Such studies have too many other kinds of failures to describe here, but the highly-touted 2011 Montreal cycle track study by Lusk and Furth [3] had a particularly serious failing. That study compared parallel streets with and without cycle tracks, but the paired streets were often radically different from one another.
One comparison, for example, was of a one-lane, one-way, low-volume residential street with a cycle track vs. a two-way, four lane street with high traffic volume and storefronts. A traffic engineering journal’s peer reviewers likely would have thrown out the Montreal study, but an injury prevention journal published it. The reviewers apparently didn’t catch this major failure of methodology.
Our Data
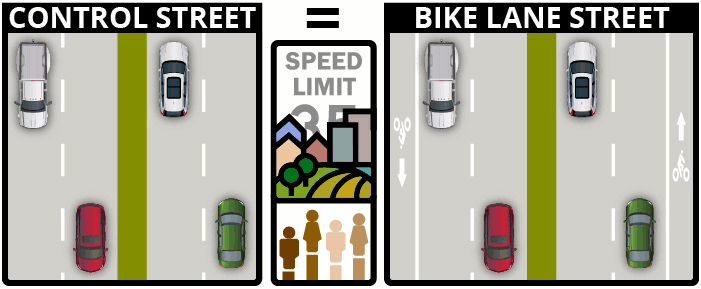
The MetroPlan study ensured that the control (no-bike-lane) streets were like the bike lane streets: same number of lanes, median type, same or similar posted speeds, similar traffic volumes, similar land use, and even similar surrounding populations.
We selected ten streets that had had bike lanes for at least ten years, and for each of them, a control street that also had not seen major changes for ten years. The streets were mostly suburban, with just a few a bit more urban.
We had ten years of crash data for all of the streets, categorized by crash type (who turned, who crossed, who violated right-of-way, etc.); the bicyclist’s position leading up to the crash (travel lane, bike lane, sidewalk or other non-roadway position); and the bicyclist’s direction of travel (with or facing the regular flow of vehicular traffic, or crossing the roadway).
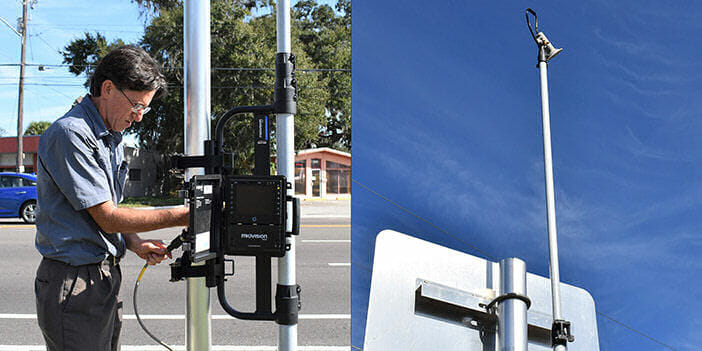
Left: Mighk Wilson with the MioVision camera system, which is portable and records 48 hours of video. Right: the pole-mounted camera provides a birds-eye view of the roadway and the sidewalk.
Video Data Collection
Using a MioVision camera, we counted bicyclists, with their position and direction, on each bike-lane street and its control street during the same 48-hour period. With this information, we were able to estimate miles of bicyclist travel by multiplying the counts by the length of the study street, and then by 1,825, which gets us from 48 hours to ten years of exposure.
With ten years of crashes and of estimated exposure, we could calculate Bicyclist Miles Between Crashes. A high number means lower risk. (I’ve rounded to the nearest thousand miles for clarity.)
With the video, we were also able to estimate typical speeds for bicyclists. Traffic engineers typically use an “85th-percentile speed” for traffic studies. (85% of the travelers are going at or below this speed.) We found the 85th-percentile speed to be 12.4 MPH for sidewalk bicyclists, 15.7 MPH for bike-lane users, and 18.4 MPH for travel-lane users.
We also looked at five shared-use sidepaths (“trails” directly adjacent to roadways) that had been in place for more than ten years, and collected the same crash and exposure data for them.
Key Findings
This section will explore the risk of a motorist-caused crash.
Most Important Factor: Bicyclist Direction
It is legal to bike against traffic on a sidewalk or path, and illegal in a bike lane or travel lane, but regardless of bicyclist position, we found bicyclist direction to be the most important risk factor. The risk ratio was the same, 5.3 times greater, except for bike lanes, where it was 4.3 times. This means that bicyclists riding against the flow of motor vehicle traffic are 4.3 to 5.3 times more likely to be in a crash than those who ride with motor vehicle traffic flow.
These results show higher relative risk than prior studies, but this study had many more streets and better bicyclist-count data. (Wachtel and Lewiston in 1993 [4] found 3.6 times greater risk, and Huang and Petritsch in 2007 [5] found 4.4 times greater risk.)
Risk by Position
So we know that going with the flow is much, much safer. But if we’re going with the flow, is it better to be along the edge of a travel lane, in a bike lane, or on a sidewalk? For bicyclists traveling with the flow, the Miles Between Motorist-Caused Crashes were:
Travel Lane Edge – 31,000 Miles (Highest Risk)
Bike Lane – 64,000 Miles
Sidewalk – 122,000 Miles (Lowest Risk)
I have assumed that the bicyclist in the travel lane is riding along its right edge. Very few bicyclists use lane control, and only a tiny percentage of crashes involves bicyclists using it. This study could not assess that strategy.
These numbers make it look like the sidewalk is the safest place to ride, with four times lower risk than the edge of the travel lane. The sidewalk looks better than the bike lane too. But stay with me…
The four main motorist-caused crash types for bicyclists going with the flow were: overtaking motorist, drive-out, right hook, and left cross. (Dooring was not a significant issue with these streets; only two of the twenty streets had parallel on-street parking. There was only one reported dooring during the ten-year period.)
Overtaking crashes are very rare. Of 428 motorist-caused crashes on these twenty streets, only ten (2%) involved overtaking motorists. Six of those ten involved bicyclists in bike lanes. But the bike lanes did show a much lower risk for overtaking crashes: 585,000 miles between crashes compared to 92,000 miles for travel-lane bicyclists.
Setting Overtaking Crashes Aside
For now, let’s set overtaking crashes aside and look at the risks for drive-outs, right hooks and left crosses. Again, we consider only bicyclists going with the flow.
Travel Lane Edge – 61,000 Miles (Highest Risk)
Bike Lane – 75,000 Miles
Sidewalk – 122,000 Miles (Lowest Risk)
Here we still see much lower risks for sidewalks, and somewhat lower for bike lanes. But why would there be lower risks for those crash types? They all occur at intersections and driveways with no sort of “protection” for the bicyclist. Don’t experienced bicyclists avoid using sidewalks — and sometimes even bike lanes — precisely to avoid such conflicts?
https://cyclingsavvy.org/wp-content/uploads/2020/07/miovision-setup-photo-featured.jpg351351Mighk Wilsonhttps://cyclingsavvy.org/wp-content/uploads/2021/06/CS-logo_xlong-header.pngMighk Wilson2020-07-17 12:55:072021-07-29 14:24:51Orlando’s Better Data Can Make You Safer On Your Own Bike
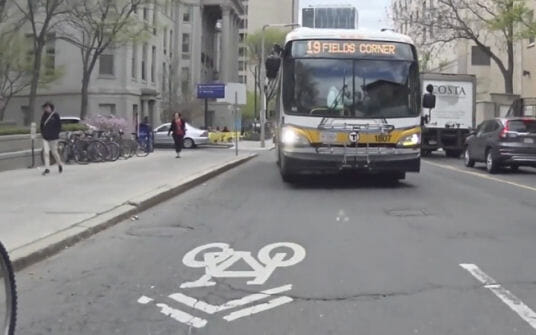
Little did he know that a yet-to-be savvy cyclist would play a starring role in it.
Here’s what the savvy cyclist did in the video.
He sees the bus stopped ahead. Well in advance of reaching it, he looks over his shoulder to check whether there is a vehicle behind him.
There is, so he makes a left-turn signal with his left arm, indicating the desire to merge left to pass the bus.
He verifies that the driver behind him is yielding to let him move left before he does so.
He passes the bus with safe clearance, ready to brake and fall back in case the bus starts to merge out from the curb.
Once in the bus driver’s forward field of view, he signals to the bus driver the desire to merge back to the right.
He positions himself so that he can see a pedestrian crossing the street right in front of the bus. He allows ample time to slow down or maneuver if a pedestrian pops into view.
After passing the bus, he adopts an appropriate lane position, preventing being overtaken by two lines of traffic at once and jammed against the curb.
The next driver behind the savvy cyclist has let him into line.
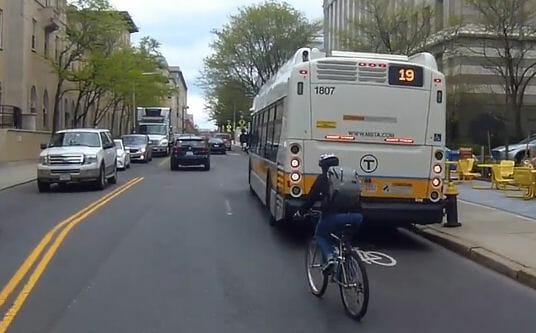
The yet-to-be savvy cyclist:
Keeps far right as long as possible before reaching the bus, and does not check for overtaking traffic.
Does not signal to indicate the desire to change lane position.
Swerves out shortly before reaching the bus, again without checking to see if there is any traffic behind.
Rides close to the side of the bus! This puts the yet-to-be savvy cyclist in danger of being swept underneath if the bus merges out.
Would not see a pedestrian crossing the street from in front of the bus until the last split second — and therefore would be likely to collide with that pedestrian.
Merges to the right without signaling to the bus driver.
Merges all the way over to the curb, inviting drivers of motor vehicles to “share” an un-sharable lane.
The other cyclist merges out just before passing the bus. What if a car, rather than another cyclist, had been following her?
I, the savvy cyclist
I’ll admit it, I was the savvy cyclist. What were my expectations?
I believed I could communicate with the driver of the vehicle behind me using a hand signal and head turn.
I knew the driver behind me had to digest my request to merge into line, so I started my communication early.
I did not assume the motorist would cooperate and let me merge, so I checked — trust but verify. This is easy to do with a quick glance into a rear-view mirror.
I understood that passing a bus close to its side places me in deadly danger if the bus merges out, and also invites unsafe overtaking.
I knew the bus driver would have an easier time knowing my intentions if he or she could see me as I prepared to merge right.
I understood that I could safely allow only one line of traffic to overtake after passing the bus. I had to position myself to avoid unsafe passing by two lines of traffic at once.
I had a mental inventory of things to watch for: the bus pulls out abruptly, an overtaking motorist moves too soon, a pedestrian abruptly emerges in front of me. But I was ready, so none of these things would cause me a problem, or even require quick action on my part.
This sounds like a lot, but it’s not. It becomes second nature when practicing “driver behavior.“
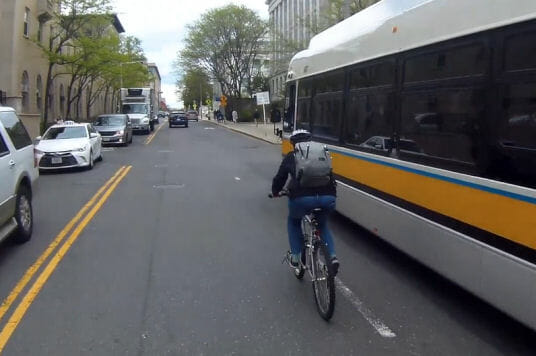
I am passing the bus safely. The other cyclist couldn’t see a person crossing the street in front of the bus, and couldn’t avoid the bus if it merged out.
The cyclist in the video was practicing “edge” behavior
Her behavior indicated that she wanted to take up as little space as possible. She was an “edge rider,” naive about potential hazards in front of her, and fatalistic about those behind her. This made her moves unpredictable and turned potential hazards into real ones.
What behavior is truly easier for motorists?
I have long contended that having to slow and follow a bicyclist disturbs motorists much less than the following confusing situations:
The cyclist is inviting me to pass, but the available width looks iffy. The angel on one shoulder says that I should wait till there is more room. The devil on the other says: ‘It’ll be close, but I’ll make it.’
Or perhaps:
The cyclist can’t continue riding behind the bus. She is either going to stop behind it, or swerve out. The angel on one shoulder says: ‘Slow down so she can swerve out in front of me.’ The devil on the other shoulder says: ‘Damn bicyclists.’
How about if you’re the bus driver:
I lie awake at night worrying that I’ll crush a cyclist under my bus.
This has happened in my city.
How much better it is for the mental health of everybody concerned for a cyclist to act as a participant in traffic, rather than a nobody!
The shared-lane marking properly indicates my line of travel. The bus changes lanes to pass me safely. The other cyclist’s wheel is visible in the corner of the picture.
Lower stress and more safety passing a bus
As for cyclists, it is infinitely more satisfying to interact as a full participant in traffic, rather than be a wallflower!
For savvy cyclists, stress levels go way down, safety goes way up — and there’s even more: A rewarding sense of interaction with other people. Almost every motorist will cooperate with you, if you only help them know how to do that.
One more thought
The driver of the vehicle behind me, intentionally or not, was standing guard for me. I was protected from following vehicles. (The word “protected” has been used and misused in other ways related to bicycling, but that is a discussion for another post.)
On any typical ride, a cyclist interacts directly with tens or hundreds of strangers, sometimes thousands. Cycling and motoring are the daily activities in which a person interacts directly with more strangers than in any others.
It’s a dance, and as we say in CyclingSavvy, the dance is yours to lead. I find it soundly rewarding to do that assertively yet cooperatively.
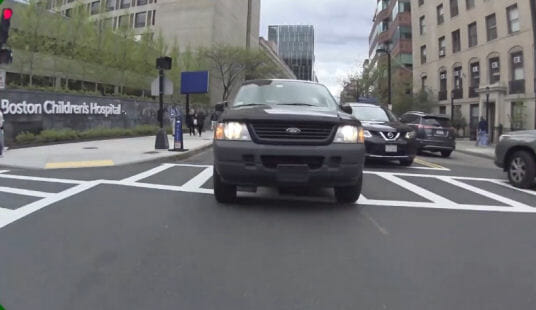
I shot this video in May 2017 on Boston’s Longwood Avenue — here, in case you would care to know. This neighborhood has a high concentration of medical, and research facilities. I may well have been photographing a doctor or scientist. Brilliance in another field doesn’t help you understand safe behavior near a bus. That’s why we need to teach all people, no matter how smart, how to ride safely.
Update
I wish that I could offer a bright and sunny conclusion to this article: Longwood-area cyclists signed up for a CyclingSavvy course, discovered how easy it is to communicate with other road users and control safe space around themselves.
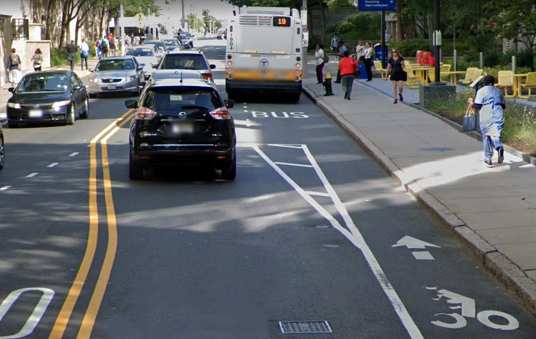
Not so. Since I shot the video, the shared-lane markings on Longwood Avenue have been replaced with bike lanes.
2019: Google street view of Longwood Avenue
These bike lanes direct cyclists to ride like the one in my video, and give motorists to understand that this is bicyclists’ proper place and conduct — as shown in the image above downloaded from a 2019 Google Street View.
Enough for now. The reasons bicyclists get set up for failure like this are a topic for another post.
https://cyclingsavvy.org/wp-content/uploads/2020/06/bus-SLM.jpg335536John Allenhttps://cyclingsavvy.org/wp-content/uploads/2021/06/CS-logo_xlong-header.pngJohn Allen2020-06-08 09:55:062024-01-15 15:44:44Passing a City Bus Safely on a Bicycle
The city of Palo Alto, California, had decided it wanted bikeways. The city got them by putting up signage, requiring bicyclists to ride on the sidewalks. Forester tried them and found them dangerous at very ordinary cycling speeds of 10-12 mph, and so he chronicled the hazards in a two-page article.
Forester cited two fatal bike/pedestrian collisions to underscore the danger of mixing bicycles and pedestrians. He wrote about turning conflicts, poor sight distances at driveway intersections, and the impossibility of making a safe and sensible left turn. Forester wrote that he hoped to get arrested, so he could challenge the city’s sidewalk requirement.
That article sparked an epiphany for me. Until then, I’d dreamed of sidepaths along all my favorite roads. Three feet wide, and just for me! Wheeeeee!
The epiphany was, “Be careful what you wish for.” Because even a city as sophisticated as Palo Alto got it completely wrong.
I learned: Sometimes, a well-intentioned intervention is far worse than leaving well enough alone. And that is just the beginning of what I learned from John Forester.
Forester died on April 19, half a year shy of his 91st birthday. The cause of death was a lingering flu, not suspected to be Covid-19. Forester left behind nearly 50 years of immense contributions to the cycling community, in ways that weren’t even imaginable before he articulated them.
My own Forester-related epiphany pales in comparison to those of many thousands of others. I was already a bike rider. Forester made me a better bike rider. Others were liberated to use their bikes to go anywhere, when they previously couldn’t.
Independent mobility for a legally blind person
No one has expressed this better than Eli Damon, a resident of western Massachusetts whose eyesight is not good enough for him to get a driver’s license:
Socializing was especially difficult for me for many reasons, but an important one was that my mobility limitations hindered my ability to act spontaneously or to interact with others on an equal basis. . . . Asking for a ride . . . left me in a constantly dependent and inferior social position. I was lonely and isolated. . . .
. . . My principal social outlet [in 2005] was my weekly choir practice, which . . . was fifteen miles away (ten miles was my limit at the time) on unfamiliar, difficult, scary roads, so biking seemed impossible. I was too far out of the way for other members of the choir to pick me up. There were no buses that could take me.
And Damon had lost his ride to the choir practice.
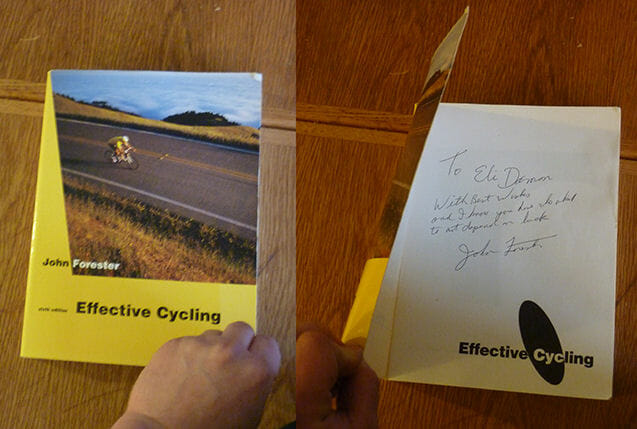
He found a cycling book that had been given to him.
Eli Damon’s copy of Effective Cycling, 6th Edition
In desperation, I dug the book out and started reading it, hoping to find a clue to my mobility problem. The book was Effective Cycling, by John Forester.
As I read the book, I became very excited. It suggested that I should ride my bike according to the same rules drivers of motor vehicles use and that I should stay away from the edge of the road, sometimes riding in the center or even on the left side of a lane, thus occupying the entire lane. I knew that the designs of roads provided a simple and predictable environment for motorists to travel with ease and flexibility. If I could use the roads in the same manner on a bike, then I could go anywhere with the same ease and flexibility. This was a totally new concept to me, and I was somewhat skeptical of it, but I recognized its immense potential.
I quickly became comfortable riding assertively on small quiet roads. I advanced my testing to bigger, busier roads. And then even bigger, even busier roads. . . I was ready to take on the scariest road I knew of: Route 9 in Hadley, a major four-lane arterial.
. . .
Eli Damon rides Route 9 in Hadley, Massachusetts
It was as if I was no longer disabled. . . I was still [legally] blind, but ignorance, not blindness, had been my disability all along. I had been healed. I could go wherever I wanted, whenever I wanted. I could do all of the normal things that other people did. I could live a full, normal life. I could go to choir practice.
And yet, Forester made many enemies in bicycling, thanks to a famously abrasive temperament. Sadly, Forester’s detractors are mercilessly dancing on his grave.
For years, Forester’s detractors have shamelessly mischaracterized his opinions with demeaning distortions and outright falsehoods. Some have written hit pieces disguised as obituaries. One obit called Forester a “Dinosaur” in the headline.
John Forester’s contributions . . . far outweigh those of his detractors.
A man who gives legally blind people independent mobility deserves a better remembrance than that.
More like this:
“John’s contributions to bicycling — as transportation, recreation, sport, a vehicle for fitness, social interaction, and discovery — far outweigh those of his detractors, wrote Pete Van Nuys, executive director of the Orange County (California) Bicycle Coalition. “John stood for, and rode for, human dignity and equality. He advocated respect for law and common sense; he trusted civility over fearmongering; he promoted responsibility of the individual above government overreach.”
Yes, one had to look past Forester’s famously abrasive temperament to get the value he offered. But there was immense value.
Because what Forester did was far better than complaining about bad bicycle facilities. He gave us the vocabulary and the framing to understand good versus bad facilities, good versus bad riding, and the root causes of crashes. He gave us the revelation that we could control the behavior of other road users to make ourselves safer. We didn’t have to be passive victims. We could create our own success on the road. On almost any road. Today.
That vocabulary and framing didn’t exist before Forester. If I may exaggerate only slightly to make the point, how good a chemist could you be if you didn’t have the periodic table of the elements?
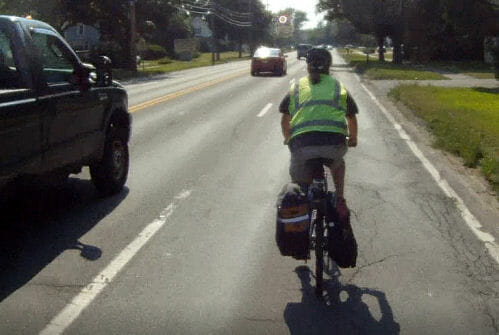
Before John Forester, we were all road sneaks.
Before Forester, almost every bicyclist rode in a style we call “road sneak,” hiding from other traffic, believing s/he didn’t belong, and even hoping to go unnoticed. Forester replaced all that with a concept well articulated by one of his best instructors, the late Steve Schmitt: “Visible plus predictable equals safe.”
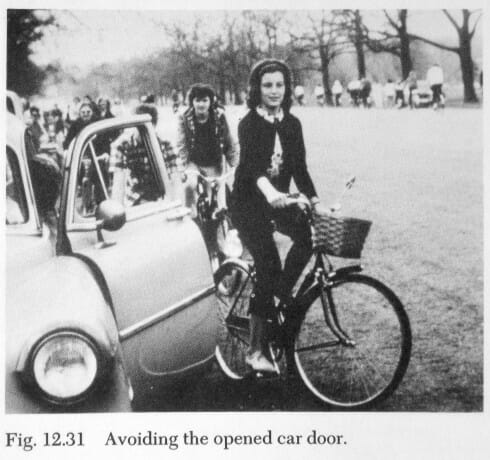
Fred DeLong’s illustration of how to avoid a car door. Well-intentioned, but this exact behavior causes many collisions, some of them fatal. Forester liberated us from this thinking.
Before Forester, other famous bicycling writers pretty much endorsed the “road sneak” vision of a cyclist’s place (or lack thereof).
Even the great Fred DeLong instructed people to ride in the door zone, with the absurd notion that you could swerve to avoid an opening car door and yet be safe. Writers Richard Ballantine and Eugene Sloane, whose books sold in the millions in the early 1970s, offered similarly hapless advice. Other authors of that era were also hapless. They were well-intentioned, but they didn’t know any better.
(In 2013, our colleague John S. Allen wrote a very good critique of the “dark ages” of bicycle safety advice before Forester. It’s at http://john-s-allen.com/blog/?page_id=5273.)
Five core principles guide our thinking
Forester’s framing began with articulating the core principles of traffic law, and telling bicyclists to follow the core principles. Today, they sound pretty mundane:
All vehicle operators keep to the right.
Yield to cross traffic according to pre-defined rules and traffic-control devices.
First-come, first-served (meaning that if someone wants to pass you, s/he must do so safely, and you still have the right to be on the road).
Destination positioning at intersections (Left-turn lanes and right-turn lanes are for everyone.)
Between intersections, you choose your position on the roadway based on your speed and on the usable width of the road.
Traffic collisions are caused by disobeying these core principles, and not by obeying them.
In 1982, Forester explained to me that these principles were not articulated in traffic engineering classes. He had ferreted them out by thinking and observing the unspoken common principles of all traffic, and seeing how they would be applicable to bicyclists.
Here’s what he said at the time (from a June 1982 article I wrote in Bicycling Magazine):
Highway people had training deficiencies because of the overwhelming success of motorization. They never had to teach any traffic engineers how to drive. They never had to teach the theory of traffic safety — the theory was implicit in everyone’s driving knowledge. Therefore, these people never questioned the principles of the ‘bike safety training’ they had received. They didn’t recognize that it conflicted with the theory behind vehicle safety.
The legislators put up money for very specific things — bikeways. So basically, society bribed the highway departments to do the wrong thing.
Forester around 1980, wired up to score students in a road test. A switch in his glove starts the cassette recorder in his backpack. Credit: IPMBA
So, Forester preached the principles of traffic law to any bicyclist who would listen.
Forester was also a keen student of the characteristics and limitations of bicycles and motor vehicles, bicyclists and motor vehicle operators. His early experience in Palo Alto made him a vigilant watchdog for unreasonable sight distances, curb radii, reaction times and intersection turning conflicts. Forester coined the term “rolling pedestrian,” and noted that even a slow bicyclist is several times as fast as a pedestrian, with very different ability to manage sharp turns and short stops. Forester observed that most bicycle facilities were designed with obliviousness to how a bad sight distance or a sharp turn could make a bicyclist crash.
(Even that observation got distorted by Forester’s opponents. Forester once wrote that a bicycle facility should be designed for a bicyclist going as fast as 30 mph, to accommodate all extremes of bicyclist behavior. His opponents turned that into, “Forester brags that he rides 30 mph.” And Forester’s advice to make traffic law work for you was twisted into “compete with the cars,” or “think you’re just like a car.” That level of distortion can best be described as mean-spirited.)
Without Forester’s innovative instruction, bicyclists of the 1970s, including those who considered themselves safety advocates, simply didn’t have the vocabulary to talk about how a bicyclist’s operating characteristics would interact with a given facility design, to produce a crash. They certainly had little notion that a bicyclist’s own behavior could make him safer.
Forester knew why bicyclists thought that way, and gave it an annoying, but accurate name: the “cyclist inferiority complex.” The cultural pull of the cyclist inferiority complex — the belief that we don’t have the full right to use the road — was, and is today, so strong that it subverts safe behavior.
We all thought we should stay out of the way of “real” traffic, hug the curb, and hope for the best.
Abrasive . . . but he wanted to sit next to me!
And with all the diplomacy of a professor dressing down an ill-prepared student, Forester told us all to think again.
So, let’s talk about his abrasiveness.
Many of us have been on the receiving end of it.
You could be in 98 percent agreement with Forester, and he’d come down on you like a ton of bricks. It sure happened to me plenty of times. I disagreed with Forester on technicalities of retro reflectivity and night time conspicuity; on developmental maturity and teaching children to ride in traffic; on an aspect of rider position during maximum-performance braking; on the political tactics of opposing or not opposing dangerous bicycle facilities; and a few other topics. I learned to ignore — and often not even read — his, uh, disagreements with me.
Still, he must have disagreed with me less often than he disagreed with many others. Because he always wanted to sit next to me in various national committee meetings.
And I watched him make an arse of himself in those meetings, grinding my teeth while it unfolded. If a well-intentioned mayor or traffic engineer used one wrong word, Forester would stand and attack. The vitriol made many of us wince, because we knew it undermined his persuasiveness.
I can’t defend the vitriol.
But in some instances I can explain it. Forester was using science and engineering to describe how bicyclist behavior and bicycle facilities could either help or hurt people. Forester took very seriously the immense responsibility of telling the public what was good for their own safety, and he expected others to gravitate to the facts he presented. When Forester’s opponents displayed obliviousness and/or defiance to the reasons why they were risking serious personal injury or death — not for themselves, but for others — Forester would attack.
It’s a shame so many people never saw past the vitriol, because there was much wisdom underneath it.
John Forester’s books, the curriculum, courses
So, let’s talk about that wisdom — and about how he promulgated it.
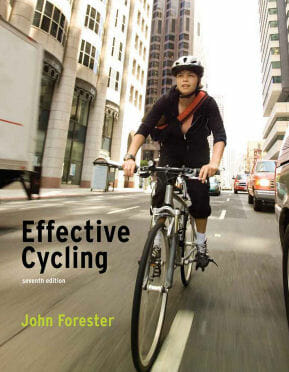
That first Bike World article gave birth in 1975 to the book Effective Cycling, which Forester self-published with his own printing press in his garage. It would go through many editions and get published by Massachusetts Institute of Technology (MIT) Press; it is now in its 7th edition.
Forester also devised a 30-hour course, also named Effective Cycling. That course made novices into cyclists who were self-sufficient and proficient in every way. In keeping with the more self-reliant ethos of that era, Effective Cyclists were expected to be capable of doing their own repairs, sewing their own cycling clothing, and making various adapters and accessories for their bikes. And, of course, they could ride confidently and safely on big arterial streets just like my buddy Eli Damon.
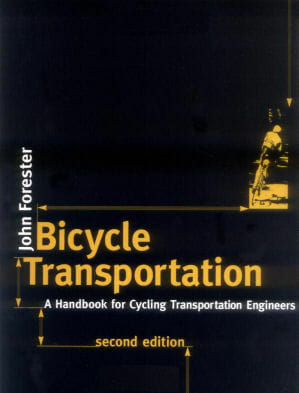
Forester also saw the need for professional training, so that engineers would not design bad bicycle facilities. This led him to write the book Bicycle Transportation Engineering, later renamed Bicycle Transportation after MIT Press picked it up.
The book Effective Cycling has a defiant, angry tone. Forester believed that you couldn’t be a safe cyclist without being aware of public policy’s endorsement of the cyclist inferiority complex, and the book gives a lengthy dressing down of that policy. Forester offered his rants, expected the reader to take his side, and then showed the reader how good cycling works. It’s not the most welcoming sales pitch I’ve ever seen. But it created an aha moment for many thousands of people.
Forester reached an agreement with the League of American Wheelmen (which subsequently changed its name to the League of American Bicyclists) to train instructors nationwide.
Forester travels the country for policy advocacy
The man went to conferences everywhere, to offer his advice on designs, and on the bad assumptions behind bad designs. No one was paying him. He did it out of a passion for safety.
In the 1970s, many people were working with this newly popular concept of adults riding bicycles. Government agencies everywhere wondered what they should be doing about it. Palo Alto’s sidewalk bikeways were only one small piece of a nationwide let’s-try-this approach to bicycle facilities.
Forester was willing and able to tell them all how it should be done. Having written his books and taught his classes, he set his sights on government policy documents.
Forester was afraid, not without cause, that government policy for bicycle facility design would shunt bicyclists off to sidewalks, leading to turning-conflict collisions and other bad outcomes. Along with other stalwarts of that era (notably the late college professor John Finley Scott and traffic engineer Bob Shanteau), Forester worked hard to make sure that the California Department of Transportation (CalTrans) policy would be good for safe cycling.
The CalTrans policy went national in 1981. Much of the language in the CalTrans policy was used in the 1981 edition of the American Association of State and Highway Transportation Officials’ Guide for the Development of New Bicycle Facilities (AASHTO Guidelines). “That AASHTO document explicitly states the detriments of bike lanes and mentions the alleged benefits in the subjunctive mode,” Forester said at the time. For once, he was actually pleased.
Forester advocated for competent, safe cycling.
But by necessity, that meant he spent most of his energy, and his audience’s attention, talking about things he was against — laws and societal customs that prohibited safe cycling. The big three such laws were laws requiring riders to ride far to the right, laws requiring bicyclists to ride in bike lanes, and laws requiring bicyclists to use sidepaths. Almost every conversation with Forester quickly turned to the bad consequences of these three.
Forester spent about $50,000 of his own money, and months of his time, in support of the California Association of Bicycle Organizations (CABO) for bicyclists’ rights in a well-known lawsuit, Prokop v. City of Los Angeles. The problem Forester was fighting was government immunity. Under certain circumstances, the government could build a bicycle facility and if the facility was dangerous, there would be no recourse for an injured cyclist. Sadly, Prokop lost that lawsuit. Forester again showed generosity to CABO when he had to give up bicycling. He donated his bikes, equipment and tools to CABO, and CABO sold them on eBay. (Not incidentally, Forester was the founder of CABO.)
Held up by Downward Pull. Yes, really!
And although Forester was known primarily for opining about traffic riding, he was a top-shelf expert in many other areas of cycling. I’ll mention my three favorites:
In August 1980, Forester published the provocatively titled “Held Up by Downward Pull” in the League of American Wheelmen magazine, explaining with great clarity the counterintuitive way a tension-spoked wheel supports the rider’s weight. (Writer Jobst Brandt is widely acclaimed for explaining this in his book The Bicycle Wheel, but Forester was a year ahead of Brandt.)
In April 1983, I had the pleasure of publishing in my very own magazine, Bike Tech, Forester’s eye-opening and ground-breaking “Physiology of Cyclist Power Production.” Forester deftly explained why measuring efficiency on an ergometer was misleading, and how the makeup of muscle tissue meant that a faster riding technique would score less efficiency in the lab.
In the 1971-1976 time period, Forester sued the then-new U.S. Consumer Product Safety Commission (CPSC) on the grounds that many of its proposed regulations were technically incompetent. He had many spot-on arguments. Accordingly, the CPSC 1976 Bicycle Safety Standard — which remains federal law today — has many numbered paragraphs that simply say “[reserved]”. The court picked through Forester’s points and upheld some and rejected others.
Back in 1977, I spent some time in a Washington, DC courthouse studying the lawsuit documents, and I marveled that a non-lawyer could get to first base arguing on his own behalf in federal court. Forester would write incisive technical stuff, and the attorneys defending the CPSC would get it struck down because he’d used the wrong-size paper. Nevertheless, he persisted. (How does this affect you today? The bikes you buy today are not burdened with useless design constraints they would have had without Forester.)
These are only three examples. There are hundreds more.
Time does not permit a listing of all the unfair criticisms of Forester’s work. But one I’ve seen repeated endlessly was that he was “against all infrastructure.” He was certainly against unsafe infrastructure. But he had no objection to rail trails, and in certain circumstances (bridges and high-traffic-volume arterial streets) he was okay with well designed bike lanes. I never asked him about secure parking or bike stations, but I believe he would have supported them.
Forester was the son of C.S. Forester, the famous British author. There was a complicated father-son relationship, and Forester’s two-volume biography of his father (available for free download at JohnForester.com) will test your attention span. Forester was born in England, and his childhood years cycling there, sharing roads with motor vehicles, demonstrated to him that bicyclists could do so safely. He frequently cited his experience in England as informing his advocacy when he moved to the U.S.
Ballroom dancer, model boat racer, photographer
John Forester was an industrial engineer with two masters’ degrees and a couple decades of work experience before he quit engineering in 1972 to go full-time on bicyclist advocacy work. He once said, “If you can’t make it as a mechanical engineer, you become an industrial engineer. If you can’t make it as an industrial engineer, you become a traffic engineer.” He wasn’t particularly modest, but that was his way of saying he had insights that many traffic engineers didn’t, without sounding too imperious about it.
The man had a human side too. He was enormously talented in more ways than I’ll ever know.
John Forester was an avid photographer with his own darkroom, an accomplished ballroom dancer, an avid square dancer, a downhill skier and active swimmer.
Forester had interests you might expect of an engineer: a broad knowledge of train engines and aircraft. He built radio controlled model airplanes and ship models. He built and raced radio-controlled model boats. He had an aquarium and, of course, lots of papers and books.
His own cycling got slower as his years went on, and continued until about age 80. His last bike had five-cog half-step gearing, with a top gear of about 78 inches. That’s about right for an old man.
“I just got rear-ended.”
Once, I saw John Forester look a bit embarrassed. It was 1986, and I was interviewing him in his house, which at that point was in Sunnyvale. It was raining cats and dogs outside.
The front door burst open, and in stormed a teenage girl. It was Forester’s significant other’s daughter. Not only was she soaking wet. She was carrying the pieces of a broken bicycle, and she was mad as a wet hen.
“I just got rear-ended,” she shouted. “The Ken Cross study says that motorist overtaking collisions are only four percent of non-fatal car bike collisions, and I just had one.” Forester responded with . . . embarrassed silence. You could see his pride that the girl knew to cite the Cross study, his horror that she’d been hit, and his relief that she wasn’t hurt.
I smiled inside. It was a unique interaction between a teenager and a semi-parental unit.
Cyclists fare best when. . .
John Forester usually spoke and wrote in long paragraphs, but his best sound bite was 13 words:
“Cyclists fare best when they act and are treated as drivers of vehicles.”
As long as this remembrance is, it leaves out many, many things. There is so much I failed to mention. Forester’s work was very far-reaching, and his motives were always to help us be better bicyclists.
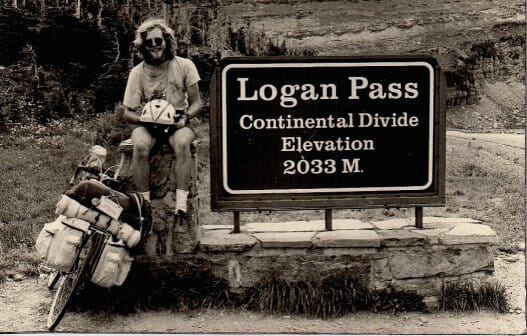
John Schubert during his transcontinental tour
Shortly after I first met John Forester, at a mini road course he taught in Washington DC in 1977, I launched on a spectacular solo 4,000-mile transcontinental tour. I was grateful for Forester’s wisdom to make myself a safer rider on that tour. My buddy Eli Damon is glad he could go to choir practice. Many thousands of others thank Forester too.
We’ve come a long way since 1977. The way we teach safe cycling behavior is far easier for a novice cyclist to learn and do. That’s the way of all improvement. Complexity starts. Simplicity follows. In future articles, John S. Allen will describe how Cycling Savvy was able to stand on Forester’s shoulders.
For that instruction to be improved on, it had to start. And it started with Forester.
Thanks, John.
With thanks to Jim Baross, Bill Hoffman, John S. Allen, Clint Sandusky, Robert Seidler, John Brooking, Eli Damon, Keri Caffrey and many others.
Countless other people had remembrances about Forester. Read some here.
https://cyclingsavvy.org/wp-content/uploads/2020/06/john-forester-feature.jpg499700John Schuberthttps://cyclingsavvy.org/wp-content/uploads/2021/06/CS-logo_xlong-header.pngJohn Schubert2020-06-02 12:55:222024-03-02 16:23:27Requiem for a Heavyweight-••-John-Forester-1929-2020
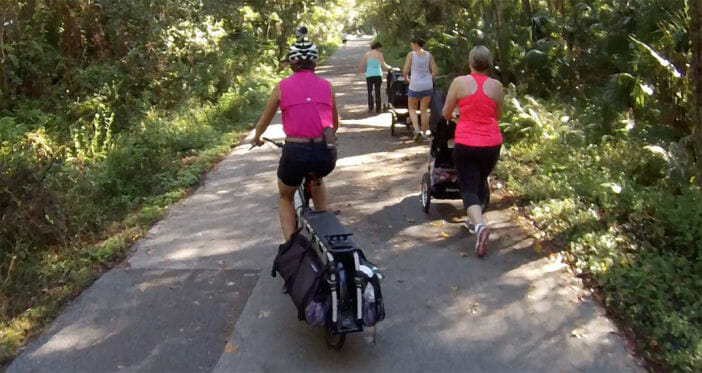
Have you been out walking or riding on your local shared-use paths? Has use been a bit heavier than usual? It certainly has been where I live.
The Orlando metro area has over 100 miles of shared-use paths. I’m an avid user, both for walking and cycling. But with increasing use, it becomes apparent that a lot of users don’t have a good grasp on safety, or how their behavior affects others — more so as new users seek fresh air and sunshine during a pandemic.
This is part one of two posts about how to be safe and considerate on shared-use paths.
Path Etiquette: ensuring you and your fellow path users have an enjoyable time.
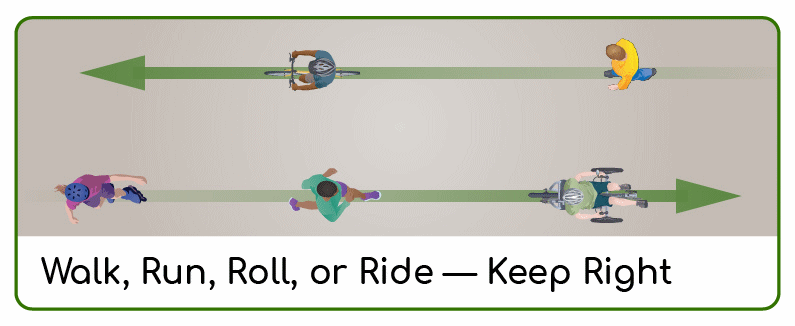
On roads, pedestrians are required to walk facing traffic, so they can see cars coming and step aside. Stepping off the road is not always necessary, but pedestrians can easily do it when it is.
Pedestrians should never be expected to step off a shared-use path or a sidewalk to make way for another user, and so it doesn’t make sense for them to walk on the left.* Doing so causes both the pedestrian and an oncoming user to have to stop whenever passing isn’t possible due to opposite-side traffic. When all users keep right, faster users can simply slow and wait for the opportunity to pass. BTW, if you cannot keep your bike balanced at walking speed, you probably aren’t ready yet to be on the path (more on that below).
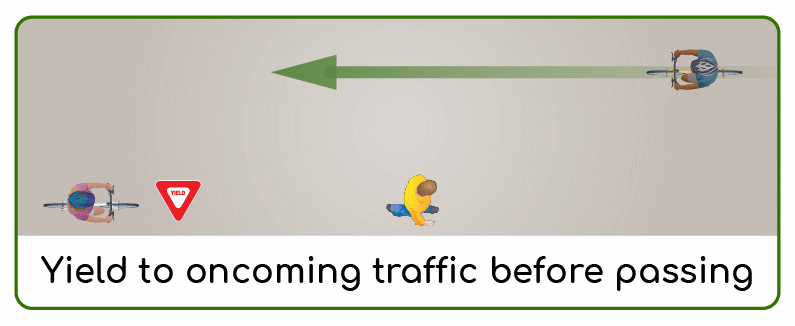
Take it easy!
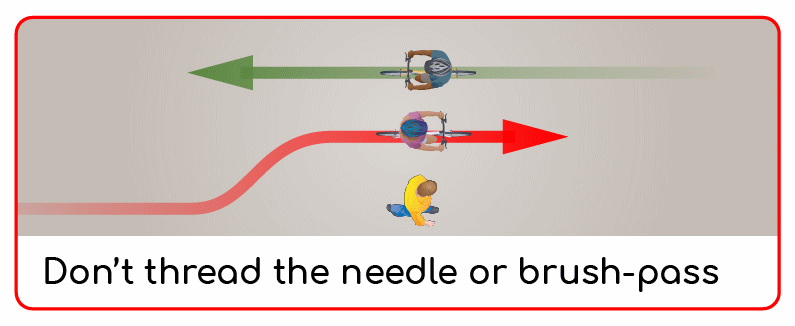
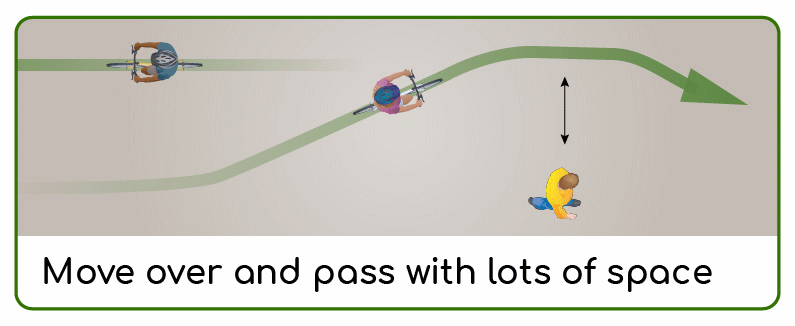
That brings me to my next point. When an obstruction is on your side of the path (or road, for that matter), YOU yield — whether it’s a fallen branch or a slower user. If there is oncoming traffic, wait until that traffic has passed. Don’t thread the needle! This is disrespectful to both the person you are passing and the oncoming person. A crowded path isn’t the place to set speed records. If you have a need for speed, you should use the road instead. When you do pass a slower user, move over! This is my chief complaint as a walker. I can’t tell you how many times a pathlete has blown past my elbow when there were eight feet of path to her left. Why would you do that? You know you hate it when motorists do that to you on the road.
It’s also nice to say something. I personally prefer to offer a gentle “good morning” vs screaming “ON YOUR LEFT.” Some people may react by moving left! Some are listening with earbuds and may not hear you. Startling them by yelling doesn’t necessarily help you pass safely.
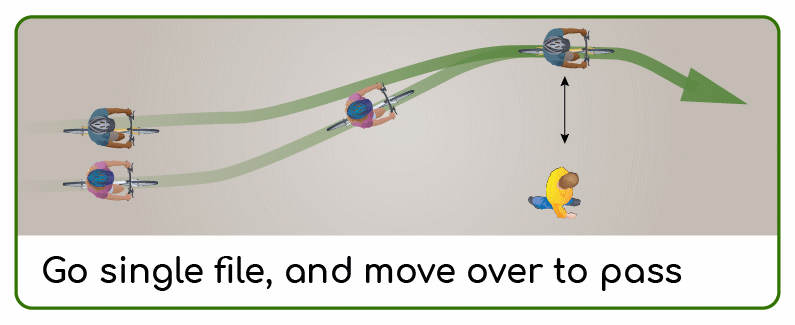
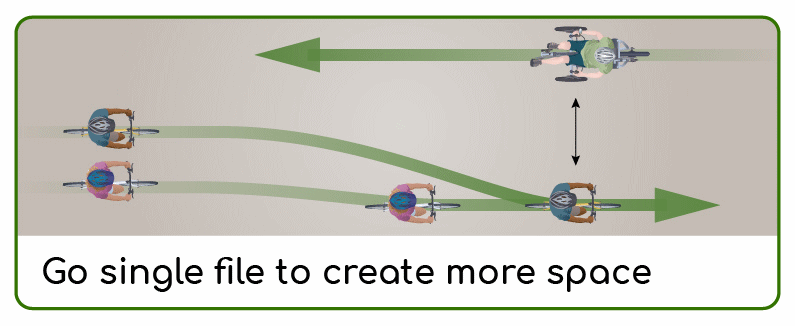
So even if you say nothing at all, moving over as far as possible and passing at a reasonable speed is fine. In this pandemic time, social distance is about more than only common courtesy. (See our recent post about riding in the pandemic.) Along those same lines, when you are riding side-by side with a companion (these days, a member of your household, I’d hope!), it is polite to single up in order to give a slower user more space when passing. Oftentimes two cyclists are so engrossed in their conversation that the left rider doesn’t even move left and the rider on the right brush-passes the pedestrian (me, yes, this happens a lot). Please be present.Similarly, many older shared-use paths are not wide enough to remain side by side when there is oncoming traffic. Without a centerline, some users don’t recognize this. The additive closing speed of both users can be disconcerting.
Shared-use path courtesy when walking
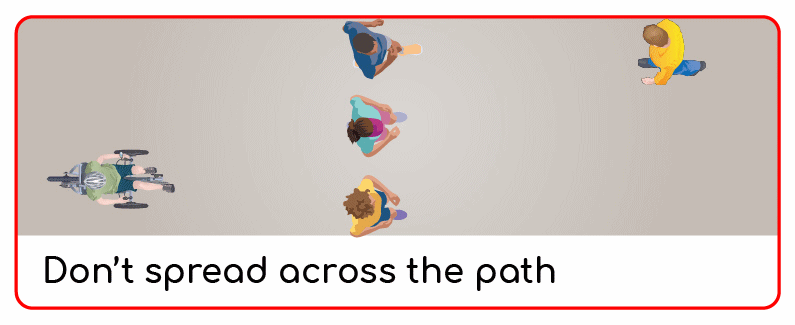
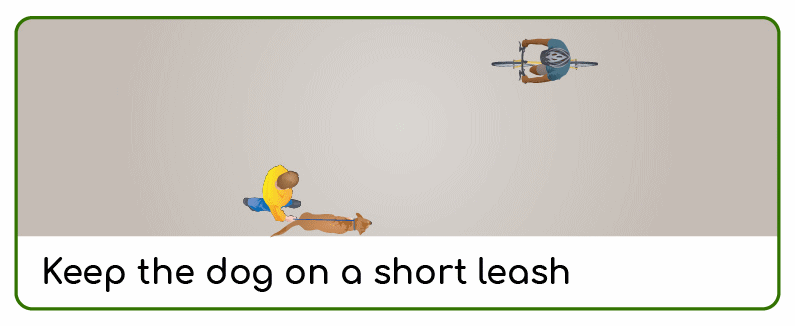
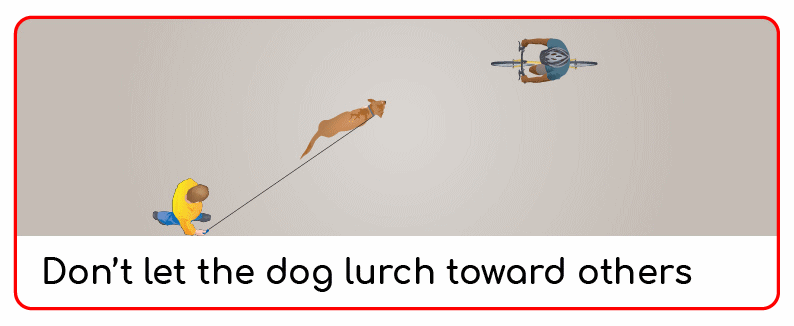
When walking or jogging with family/friends, do not spread across the path requiring every other user to have to ask you to move in order to pass. I’ve walked many path miles with my dog. I trained her to walk on my right. She does this by default now, so I never have to worry about her wandering out in front of someone. A well-behaved dog makes everyone’s life easier on the path. It’s very alarming for bicyclists to have a dog on a retractable leash run across in front of them or wander toward them while the owner appears distracted. Dogs can cause a crash! Some people have a fear of dogs due to having been attacked. Having a dog lurch toward them can cause panic.
Another point on retractable leashes: they can cause cuts and burns to both pets and people.
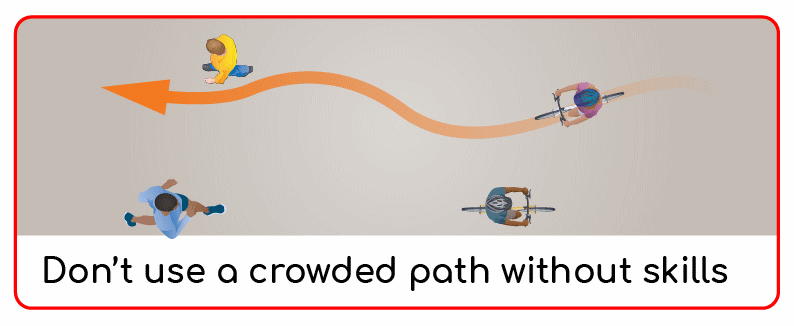
Brush up on skills
Though it may not seem to make sense, the path is NOT the place to learn bike handling. You need a set of simple skills before you ride on the path, especially a well-used path. To be safe around others, you need to be able to:
start and stop easily,
balance at very low speed,
ride in a straight line,
look over your shoulder while riding in a straight line (particularly if the path goes alongside a road, more in part 2).
This is true for kids as well. Please don’t bring your kids to the path to teach them basic skills. Children (and adults) tend to have target fixation when learning basic balance on a bike. A kid will literally ride straight into an oncoming bicyclist instead of steering away. A kid will also ride off the edge of the path and then fall, trying to steer back over the pavement lip.
Skills can be developed in a parking lot or quiet street. Or in a CyclingSavvy Train Your Bike class.
Using shared-use paths in the dark
Most shared-use paths are technically “closed” from dusk to dawn even though they are not physically closed. Many of us use them anyway, either for commuting or early morning exercise. And you know what, they were built with transportation funds, so… that’s a rant for another time.
Rule 1. Use lights! Head-on collisions between unlit users are a thing—they can be a deadly thing. Don’t count on well-lit cyclists to see and avoid you, either. It isn’t easy to detect an oncoming ninja outside the range of a headlight, and closing speed can make the range of a headlight too short to react. I’ve learned to look for the tiny glint of pedal reflectors, which is how I saw this guy coming:
The burden of care rests with faster users — bicyclists — but pedestrians also do well to carry a light and wear reflectorized items. In a few places, this is required by law.
Rule 2. Aim bright lights down. I love that bright headlights have become so affordable. I’m old enough to remember when a 300 lumen bike light cost more than a bike. Now you can get 3x that for $30. But with great brightness comes great responsibility… to not blind your fellow users. The old “be seen” weak headlights needed to be aimed straight out at the horizon for maximum visibility. Today’s 900 lumen LED lights should be aimed toward the ground ahead of you. This is not only to keep you from blinding other people, it helps you see debris or pavement issues that could cause you to fall. The best bicycle headlights have a flat-top beam pattern to cast the beam farther without glaring into people’s eyes.
Rule 3. Don’t flash! When it’s dark out. that bright headlight should stay on steady mode. First of all, a flashing headlight is blinding and annoying. It keeps other users from being able to gauge your speed and location. And most importantly, it can cause an epileptic seizure in a vulnerable person. You could literally kill someone with that thing.
If you want to have a blinkie to catch attention, there are lots of little low-powered lights you can pick up for a buck apiece and strap onto your helmet or bike. Here is some good advice on headlights.
Next: Safety
The next post will cover safety concerns. We’ll look at some path hazards, and discuss intersection safety.
Have fun out there!
* Yeah, there’s always some dumb law out there. This is no exception. Rhode Island requires pedestrians to walk on the left on shared use paths.
https://cyclingsavvy.org/wp-content/uploads/2020/05/path-etiquette-feature-702x373-1.jpg373702Keri Caffreyhttps://cyclingsavvy.org/wp-content/uploads/2021/06/CS-logo_xlong-header.pngKeri Caffrey2020-05-30 09:00:022020-07-20 22:10:40Shared-Use Paths, Part 1: Etiquette
At CyclingSavvy we teach communication with other road users. But there’s a part of the course called “Train Your Bike.”
Cute catchphrase? Well, sort of. You are actually training yourself, but “training the bike” is how it feels. We want you to feel at one with your bike.
Many riders never learn to be one with their bike when they are starting and stopping.
It sounds so basic. Why spend time on it? How could people possibly screw up starting and stopping enough for that to be a problem?
Well, they can and it is.
Lowering the stress level
CyclingSavvy founder Keri Caffrey once had a student who was a super-experienced athlete. The student had completed a half-Ironman triathlon. But for her, starting and stopping were near-crashing events. She wobbled scarily at slow speed — and slow speed is part and parcel of every start and stop. Keri’s instruction lowered that student’s stress level enormously.
You don’t have to be a serious triathlete to need this instruction. Look around at other cyclists, and you’ll see:
People don’t stop at stop lights because their stop/start skills are so poor. (Double that when an unskilled rider gets a pedal-binding system.)
If someone does stop, it’s disturbing to watch, and so are the first 30 feet after restarting.
Just as you come to a stop sign, there is a gap in the cross traffic. Is it long enough? That might depend on your being ready for a quick restart.
Category IV (novice) mass-start road race starts are scary. People don’t accelerate smoothly away from the starting line.
The solution is right here!
This can be fixed. Easily. But you have to know how.
If you follow all the steps in sequence, every start is smooth. Every stop is smooth. None of these steps is difficult. None requires fancy bike-handling skill. But you have to know them and understand them.
This is exactly what we teach in Train Your Bike.
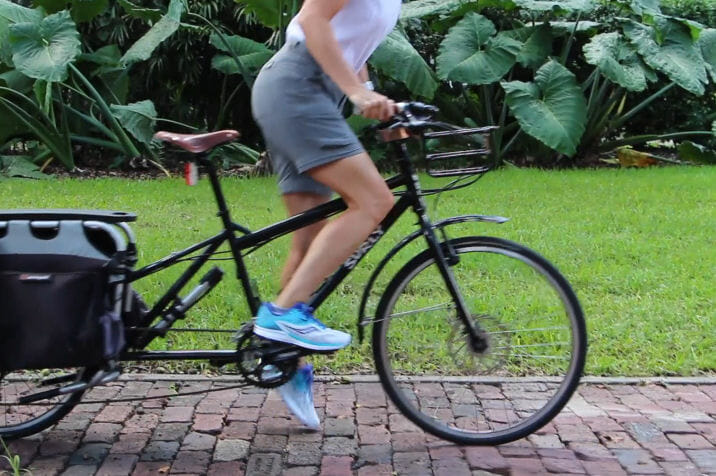
It looks so easy. Because when you start and stop the best way, it’s a non-event.
To start, you lift a pedal to the power position while straddling the bike, with your butt in front of the saddle. Stand on the one pedal, lift your butt up and slide it rearward. Put your other foot on the other pedal and continue pedaling.
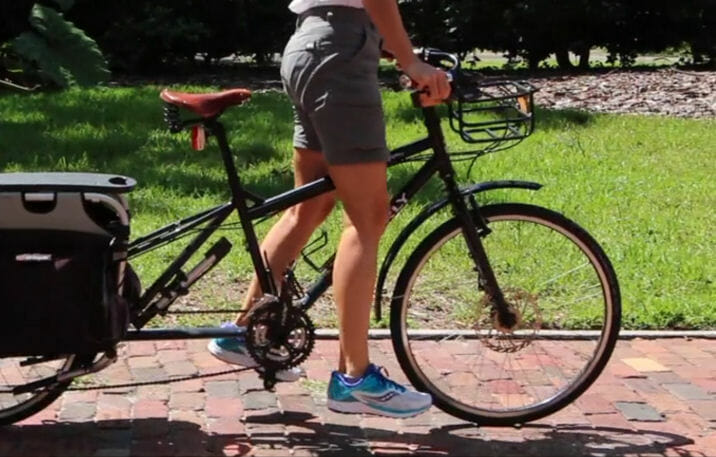
To stop, use the brakes to stop the bike, slide your butt forward off the saddle and put your weight on one foot. Lean the bicycle toward the other foot — so it is outboard of the pedal. Put that foot on the ground just as the bike stops. You use that foot and your hands to hold the bike while it’s stopped. And you use the other foot to lift a pedal into the power position for your next start.
Putting a foot down for a landing
We love teaching starting and stopping — and other skills — because we love to see both novices and experienced riders discover entirely different and better ways to do things on their bikes.
Try practicing this skill. Watch the video a few times. Then follow up with practice, so the sequence unfolds smoothly. It takes practice, as the saying goes, to get to Carnegie Hall.
In 2019 Great Rivers Greenway contracted with American Bicycling Education Association to create this lunch & learn-style presentation for St. Louis-area law enforcement officers.
The contractual agreement includes allowing any CSI to adapt and present CS for LEOs in their markets. Download P...
…about bike lanes in Philadelphia, I showed how I rode on Spruce Street, a narrow one-way street in Center City with a bike lane.
When my safety required it, I merged out of the bike lane — for example, whenever I might be at risk from a right-turning motor vehicle. At those times, it was safest to be in line with motor vehicles, where the driver behind me could see me.
Such Assertiveness May Seem Strange and Forbidding
It’s indeed counterintuitive to practice “driver behavior,” and take your place in the queue with motor vehicles. Yes, they are big, and heavy, and they can go fast. But these vehicles also are controlled by drivers. You use head turns and hand signals to communicate with drivers, and move into line when one has made room for you. That driver’s vehicle is protecting you from all the other ones behind!
Putting “driver behavior” into practice on Spruce Street was easy, as traffic there is mostly slow. I had no trouble just falling into line with vehicles waiting at a traffic light.
A First-Timer’s Mistakes
If you think that CyclingSavvy Instructors always do everything right, watch today’s video. This was my first ride ever on Spruce Street. I wouldn’t do everything quite the same way a second time.
There were a couple of times when I didn’t move far enough OUT of the bike lane. I was in line with motor traffic, but I stayed in the right tire track — on the passenger side of cars — so that bicyclists in the bike lane would show in my video.
Right Tire Track Distracted Me From My Safety
That distracted me from an option which would have made my ride go better. As I reviewed raw footage, it dawned on me that most of the streets which cross Spruce Street are one-way. Some are one way right-to-left, others left-to-right.
I could take advantage of this!
Avoiding Unnecessary Delay at Intersections
Look at the incidents at one-way left-to-right cross streets. In one of these, a motorist ahead of me pulled over to the right curb just past the intersection. In the other, a motorist behind me turned right. Neither used turn signals. The driver who merged right delayed me, and I delayed the one who turned right.
Things would have gone more smoothly if I had been riding farther to the left. That is my usual practice where traffic can turn right, but it is even more emphatically correct where traffic can’t turn left.
I still won’t pull all the way over to the left, out of line with the motor traffic: even if a motorist is unlikely to turn the wrong way into a one-way street, one could still merge over to the left curb, like the one who merged over to the right curb in my video. It’s safest to wait in line.
Just For Fun
I’ve included a third incident where the mistake was made years earlier, in the design department of an automobile manufacturer halfway around the world.
In this segment, the driver did use a turn signal, but it was so far around on the other side of the car, I couldn’t see it.
This driver was yielding right-of-way to me when I should have yielded to him. To avoid a “no, you go first” situation, I went ahead. If I’d known that the driver wanted to turn right and would have to follow me, I would have been more assertively polite. Why would I want motorists behind me if they don’t have to be? I don’t!
The first two incidents illustrate why I never assume motorists will use their turn signals. The third incident brought home to me that I sometimes can’t assume that they are not using turn signals.
Savvy Cyclists Learn From Their Mistakes
While I kept safe, the encounters I’ve described could have gone more smoothly. Every ride can be a learning experience, and the next ride can go better.
More to Come
I have one more post about Spruce Street on the way. So far I’ve done my best to avoid discussing politics and religion.
But in my final Spruce Street post, churches are involved. In that post I’m going to let loose!
https://cyclingsavvy.org/wp-content/uploads/2019/12/Screen-Shot-2019-09-30-at-1.39.50-PM.jpeg744873John Allenhttps://cyclingsavvy.org/wp-content/uploads/2021/06/CS-logo_xlong-header.pngJohn Allen2019-10-04 09:00:202020-07-21 23:26:25A Philadelphia Bike Lane Learning Experience